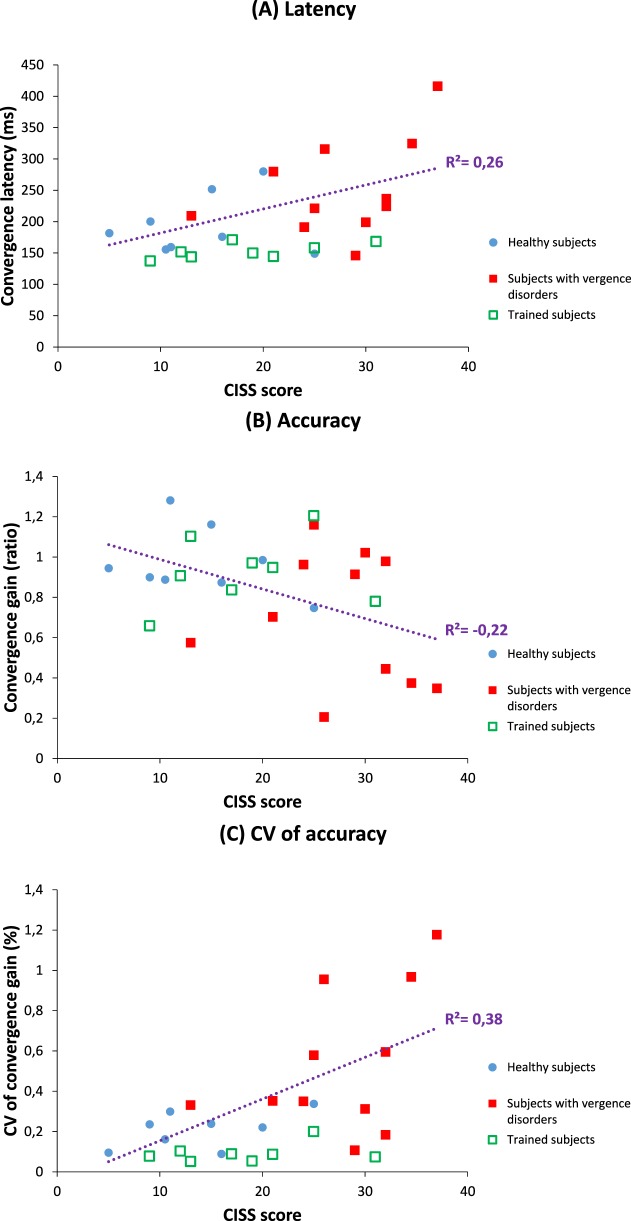
Figure 7.
Convergence latency is correlated positively with symptomatology measured by CISS score (A), and convergence gain is negatively correlated with symptomatology (B), while it is positively correlated with the variability of convergence gain (C). Data from healthy subjects are illustrated in blue circles, and for subjects diagnosed for vergence disorders, with full red squares (before rehabilitation) or empty green squares (after Vd-s rehabilitation); linear correlation model was run by considering only the data from the healthy and vergence disorder groups before rehabilitation. Values of subjects after rehabilitation are shown for illustrating the clear move towards normal levels.

