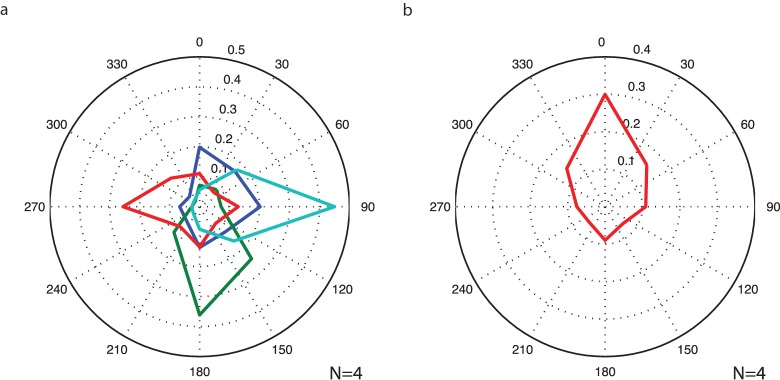
Figure 4.
Distribution of eye movement directions during subjective fixation of retinotopically eccentric points. Histograms plot the direction of the movement vectors from sequential 100 ms epochs of eye-tracking data. (a) Fixation targets plotted separately (up, down, left, right = blue, green, red, aqua). (b) Pooled conditions. Data from each fixation condition are rotated as if fixating at a point above the fovea.

