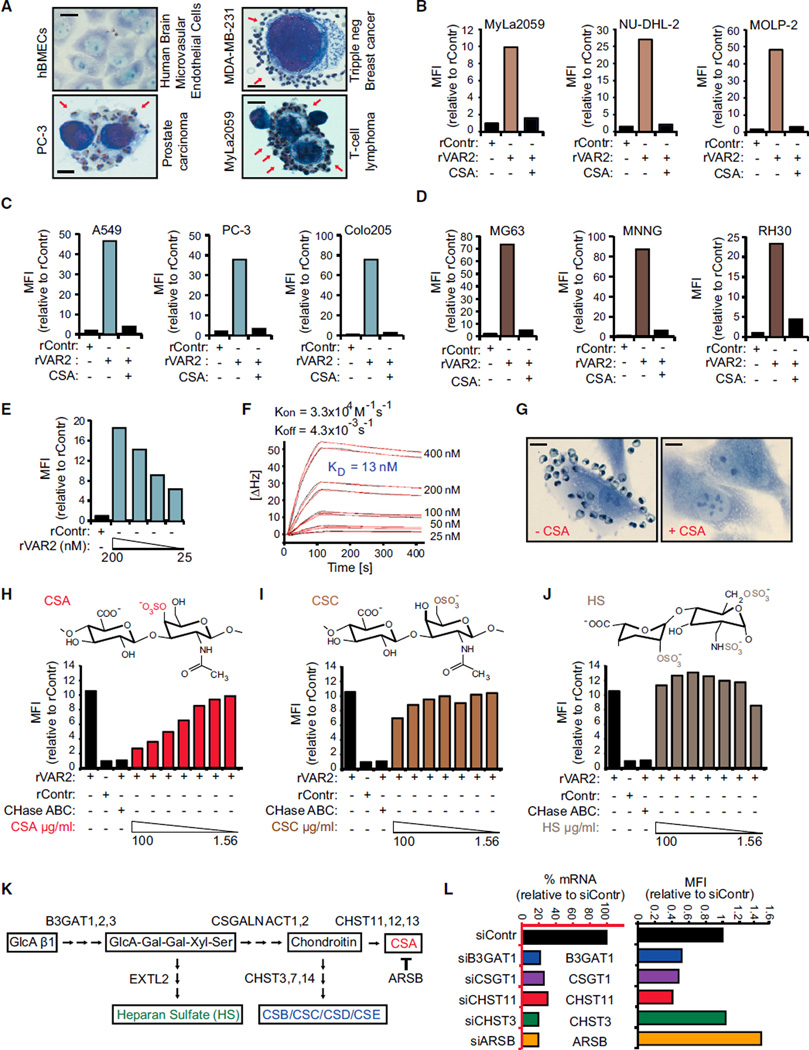
Figure 2. rVAR2 Detects pl-CS on Cancer Cells.
(A) Representative images of indicated normal primary cells (hBMECs) and tumor cells (PC-3, MDA-MB-231, and MyLa2059) with adherence P. falciparum-infected, VAR2CSA-expressing human erythrocytes (red arrows). The scale bar represents 1 µm.
(B–D) Relative mean fluorescence intensity (MFI) of representative hematological (B), epithelial (C), or mesenchymal (D) lineage human cancer cell lines incubated with recombinant rContr or rVAR2 in combination with soluble CSA as indicated and detected by flow cytometry using anti-V5-FITC.
(E) C32 human melanoma cells incubated with recombinant rContr or indicated concentrations of recombinant rVAR2 analyzed as in (B).
(F) Sensorgram showing binding between recombinant VAR2CSA and immobilized C32 cells measured in delta Hertz [ΔHz] as a function of time (s) using the indicated concentrations of recombinant protein. The black lines represent data and the red lines represent fitted curves attained by a 1:1 binding model. The affinity is given as KD values calculated from Kon and Koff.
(G) Representative images of C32 melanoma cells flushed over with P. falciparum-infected human erythrocytes in absence (−CSA) or presence (+CSA) of soluble CSA. The scale bar represents 1 µm.
(H–J) Relative mean fluorescence intensity (MFI) of C32 melanoma cells incubated with recombinant rContr or rVAR2 in combination with chondroitinase ABC (CHase ABC), soluble CSA, (H), CSC (I), or HS (J) as indicated and detected by flow cytometry using anti-V5-FITC.
(K) Schematic illustration of key enzymatic events in the CS synthesis pathway.
(L) rVAR2 binding (black bars, right) and RT-PCR readout of mRNA levels (blue bars, left) of U2OS cells transfected with control (C), B3GAT1 (B3), CSGALNACT1 (CSG), CHST11 (C11), CHST3 (C3), or ARSB (AB) siRNAs.
See also Figure S2 and Table S1.

