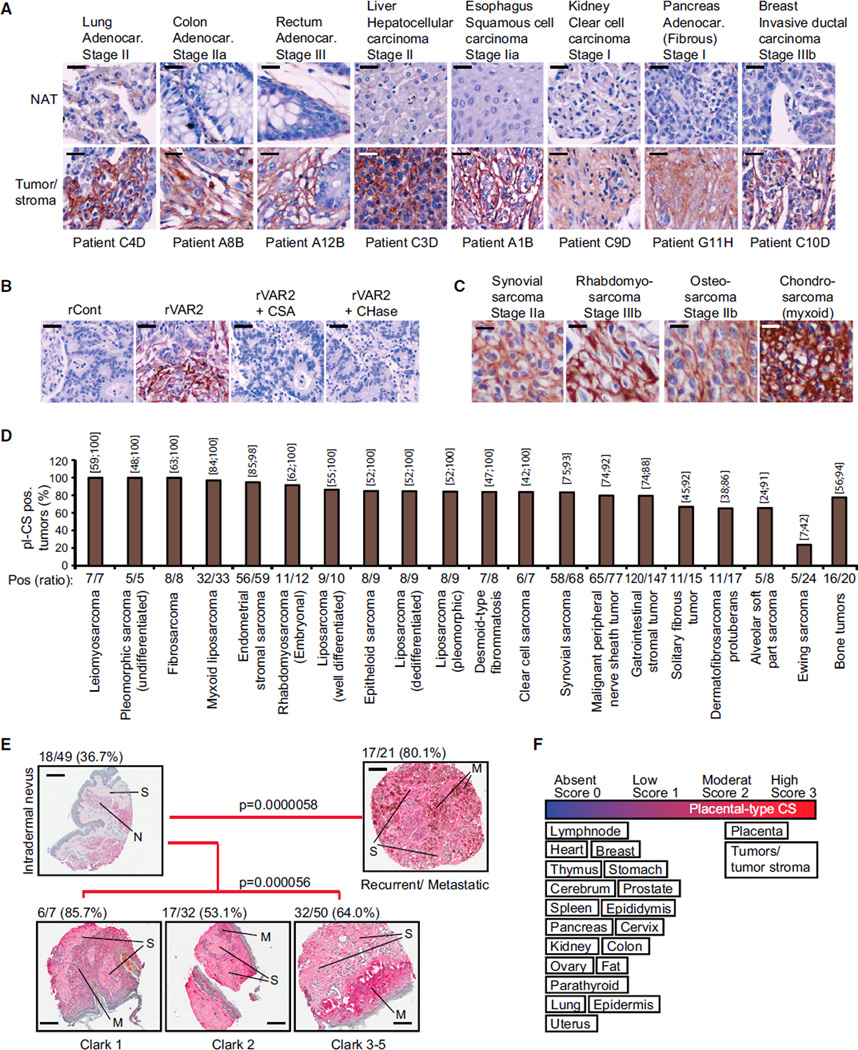
Figure 3. Diverse Types of Human Cancer Express pl-CS.
(A) Representative images of indicated patient-matched primary tumor and normal adjacent tissue (NAT) specimens stained with rVAR2-V5 and detected by anti-V5-HRP. The scale bar represents 10 µm.
(B) Representative images of stage IIa breast tumors stained with rContr or rVAR2 as in (A) with or without soluble CSA or chondroitinase ABC (CHase ABC). The scale bar represents 10 µm.
(C) Representative images of indicated soft-tissue and bone sarcomas stained with rContr or rVAR2 as in (A). The scale bar represents 5 µm.
(D) Column graph representation of pl-CS staining intensity in the indicated soft-tissue and bone sarcoma subtypes (n = 552) processed as in (A) and scored (0–3) for binding to recombinant VAR2CSA. The columns show the percentage and exact binomial 95% confidence interval of pl-CS positive (score 2–3) tumors.
(E) Representative images of a melanoma progression TMA stained with anti-V5-HRP in combination with recombinant rVAR2 and scored (0–3). The fraction of score 2–3 (moderate/high) pl-CS (pl-CS) positive tumors was identified and p values were generated by the Goodman-Kruskal-Gamma test (Nevus, N; Stroma, S; and Melanoma cells, M). The scale bar represents 40 µm.
(F) Schematic representation of pl-CS expression in the indicated tissue categories.
See also Figure S3 and Table S2.

