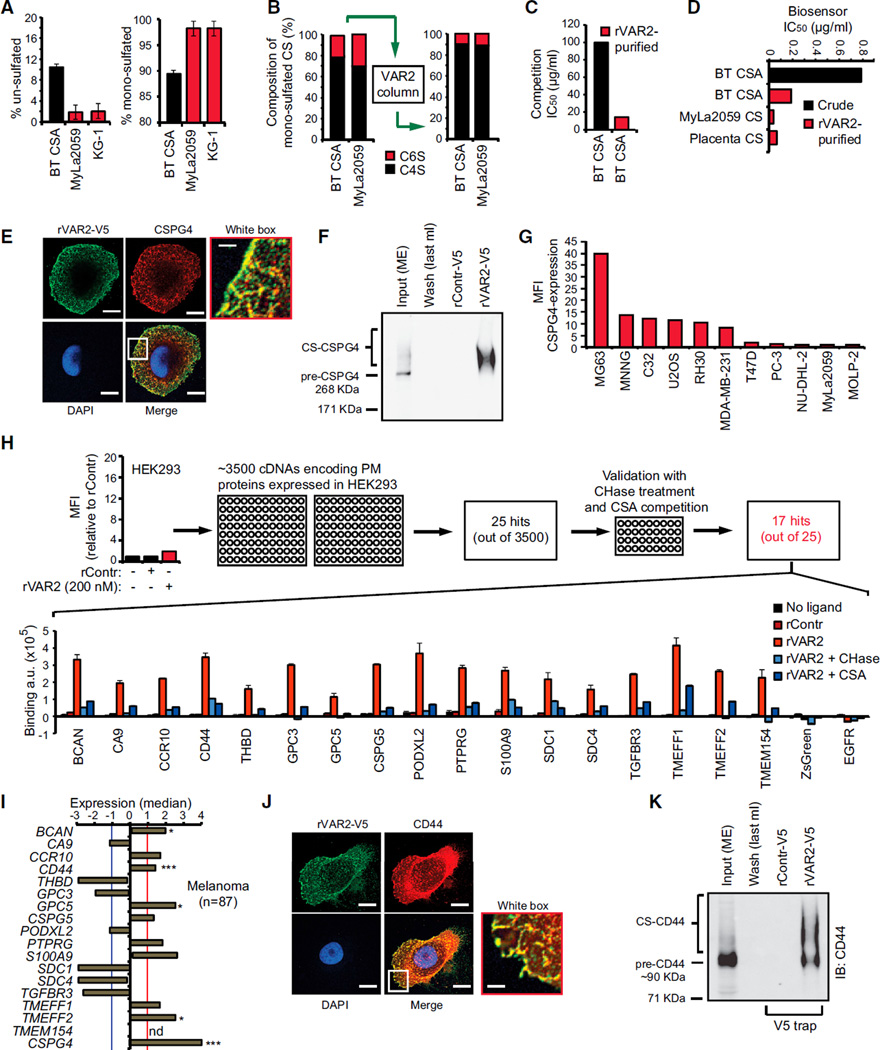
Figure 4. Defining the rVAR2 CS Epitope.
(A) Level of un-sulfated (left) and mono-sulfated (right) disaccharides of extracted CS from Sigma BT-CSA, T cell lymphoma (MyLa2059), and myeloid leukemia (KG-1) determined by liquid chromatography MS analysis. The values are given as a percentage of the total CS in the sample.
(B) BT-CSA and MyLa2059 CSA were affinity purified on a custom made rVAR2 column and eluted in a NaCl gradient. The composition of the mono-sulfated CS was analyzed by tandem MS before (left) and after (right) affinity purification.
(C) Binding inhibition capacity of BT-CSA before and after rVAR2 affinity purification is shown as the concentration needed to block 50% of the binding (IC50 values) between rVAR2 and the cells as measured by flow cytometry.
(D) Biosensor analyses of the capacity of BT-CSA (before and after rVAR2 affinity purification) and rVAR2 affinity-purified Myla2059 and placental CS, to inhibit rVAR2 binding to immobilized CSPG. The binding inhibition is shown as the concentration needed to block 50% of the binding (IC50 values) between rVAR2 and the cells.
(E) Representative picture of a C32 human melanoma cell co-stained for CS using rVAR2-V5 (green) and CSPG4 (red). The co-localization was analyzed by confocal microscopy. The scale bar represents 0.5 µm.
(F) Extracted membrane proteins (Input ME) from C32 melanoma cells were subjected to anon-column pulldown on a HiT rap NHS column coupled with rVAR2-V5 or rControl-V5. The figure shows Input (ME), last 1 ml of wash of the rVAR2-V5 column, and the 0.5 M NaCl elution following concentration. The samples were analyzed for precipitation of precursor (pre-CSPG4) and CSA-conjugated CSPG4 by immunoblotting (IB:CSPG4) as indicated.
(G) Relative mean fluorescence intensity (MFI) of indicated cell lines incubated with anti-CSPG4 antibody and detected by flow cytometry.
(H) Relative mean fluorescence intensity (MFI) of HEK293 cells incubated with recombinant rContr or rVAR2 as indicated and detected by flow cytometry using anti-V5-FITC. The HEK293 cells were transfected with 3,500 cDNAs encoding known tumor-associated plasma membrane proteins inserted in a ZsGreen expression system and analyzed for their ability to facilitate binding to recombinant rVAR2 detected by anti-V5-Alexa647. The column graph displays quantified anti-V5-Alexa647 detection (arbitrary units, a.u.) in HEK293 cells transfected with the indicated plasma membrane proteins and left un-treated (no ligand), or treated with recombinant rContr, rVAR2 alone, or in combination with chondroitinase ABC (rVAR2 + CHase) or purified CSA (rVAR2 + CSA).
(I) Median expression compared to overall average of the genes encoding the 17 proteins from (H) plus CSPG4 in primary melanoma (n = 87) patient specimens extracted from the Oncomine Riken melanoma array (*p < 0.05 and ***p < 0.001) (not determined: nd) (missing probe). The red and blue cross-lines designate the threshold for up and downregulated.
(J) Representative picture of a C32 human melanoma cell co-stained for CS using rVAR2-V5 (green) and CD44 (red). The co-localization was observed by confocal microscopy. The scale bar represents 0.5 µm.
(K) Extracted membrane proteins (Input ME) from C32 melanoma cells were subjected to an on-column pulldown on a HiTrap NHS column coupled with rVAR2-V5 or rControl-V5. The figure shows Input (ME), last 1 ml of wash of the rVAR2-V5 column, and the 0.5 M NaCl elution following up-concentration. The samples were analyzed for precipitation of precursor (pre-CD44) and CS-conjugated CD44 by immunoblotting (IB:CD44) as indicated. The error bars indicate ± SD.
See also Figure S4 and Tables S3–S5.

