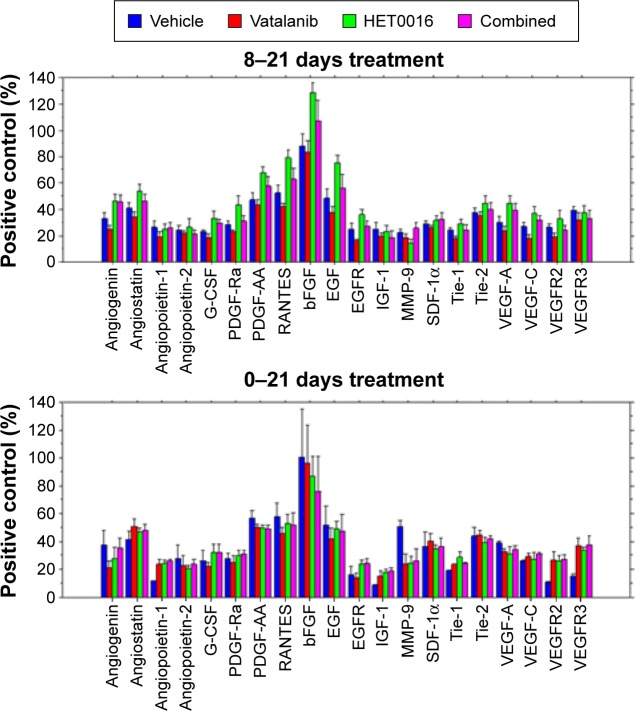
Figure 4.
Protein array analysis.
Notes: Custom-designed protein array membrane was used to determine the expression of different growth factors and cytokines. The protein array membranes were imaged using luminescence imager, and each spot with signal intensity was measured using a circular ROI. The ROI size was kept consistent from array to array and spot to spot, making the variation subtle. Protein array values normalized to corresponding positive control show differential expressions of proangiogenic and growth factors based on the schedules of treatments and the added drugs. Late treatment with HET0016 caused significantly increased expression of many factors.
Abbreviations: ROI, region of interest; HET0016, N-hydroxy-N′-(4-butyl-2-methylphenyl)formamidine; G-CSF, granulocyte colony-stimulating factor; PDGF-Ra, platelet-derived growth factor receptor A; PDGF-AA, platelet-derived growth factor AA; bFGF, basic fibroblast growth factor; EGF, epidermal growth factor; EGFR, epidermal growth factor receptor; SDF-1α, stromal cell-derived factor-1 alpha; VEGFR, vascular endothelial growth factor receptor.

