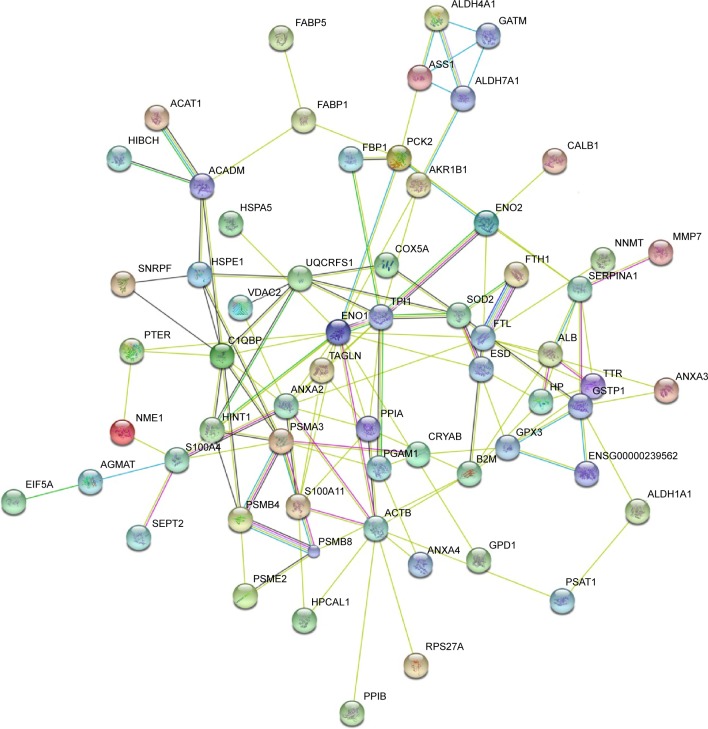
Figure 5.
Signaling networks/functional analysis of dysregulated proteins in RCC.
Notes: The identified differentially expressed proteins were analyzed using the STRING tool.14 In this map, the network nodes represent proteins. The edges represent predicted functional associations. An edge may be drawn with several different lines. These lines represent the existence of several types of evidence used in predicting the associations.
Abbreviation: RCC, renal cell carcinoma.

