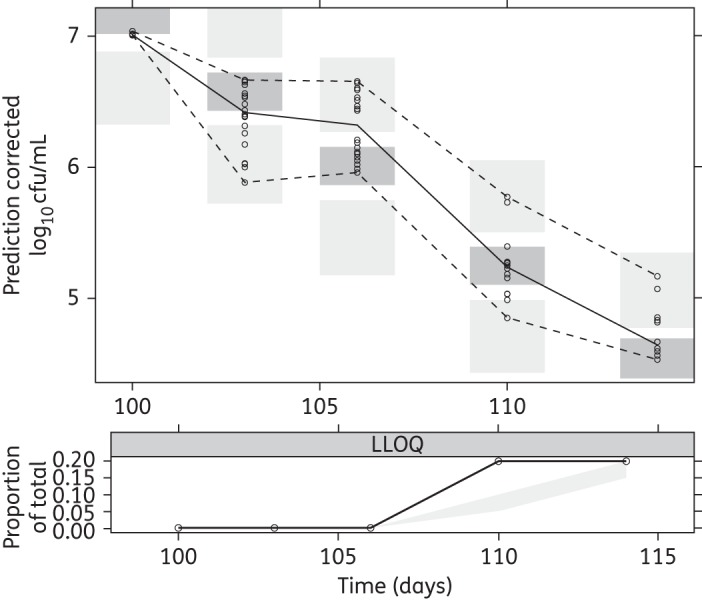
Figure 7.

pcVPC for stationary-phase data of the final multistate tuberculosis pharmacometric model using log- and stationary-phase H37Rv M. tuberculosis in vitro and different static rifampicin concentrations. Open circles are prediction-corrected observed stationary-phase log10 cfu data after different static rifampicin concentrations, the solid line is the median of the observed data and the dashed lines are the 5th and 95th percentiles of the observed data. The top and bottom shaded areas are the 95% CIs for the 5th and 95th percentiles of simulated data. The middle shaded area is the 95% CI for the median of the simulated data. The black solid line in the lower plot is the median of data below the LOQ. The shaded area in the lower plot is the 95% CI for the simulated LOQ data.
