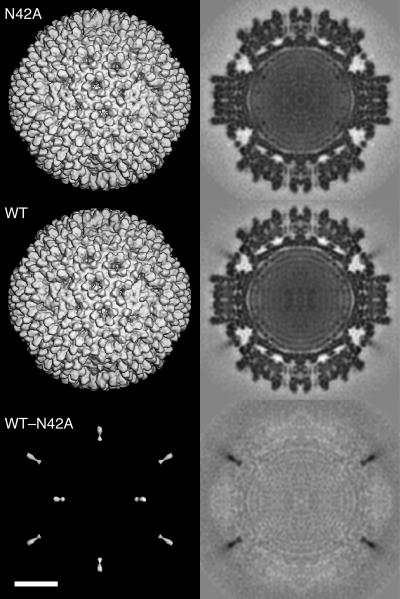
FIG. 2.
Three-dimensional-image reconstruction of μ1N42A recoated particles. Shown are surface-shaded representations (left) and central, density-coded sections (right) of μ1N42A r-cores (top row) and μ1WT r-cores plus σ1 (middle row) and a difference map obtained by subtracting the densities of the former from those of the latter (bottom row). Both reconstructions, as well as the difference map revealing σ1- but not μ1-related densities, are shown at 17.6-Å resolution. Scale bar, 200 Å.

