Figure 1.
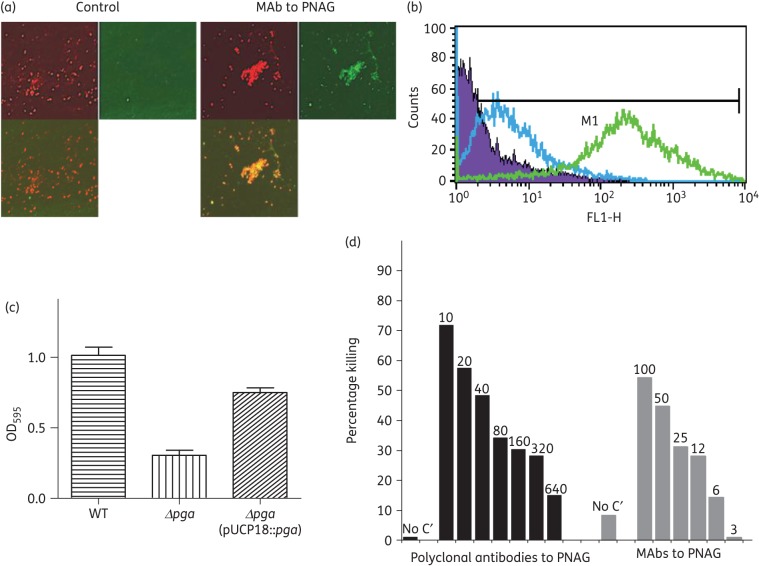
E. cloacae and PNAG production. Detection of PNAG on the surface of E. cloacae 2a using immunofluorescence confocal microscopy (a) and flow cytometry (b). Binding of MAb F598 to PNAG conjugated to AF488 [green fluorescence in (a) and green curve in (b)]. No binding with the control MAb conjugated to AF488 was detected [lack of green fluorescence in (a) and blue curve in (b)]. In (a), SYTO 83 was used to visualize DNA (red fluorescence) and an overlay of red and green channels is presented. (c) Formation of biofilms after 2 days of growth at room temperature comparing E. cloacae 2a, E. cloacae 2a Δpga and E. cloacae 2a Δpga (pUCP18::pga). (d) Opsonophagocytic killing of E. cloacae 2a mediated by polyclonal antibodies and MAbs to PNAG. Bars represent mean percentage of killing relative to the control containing NGS or the control MAb F429. All standard deviations (not shown) were <15%. Assays were done in duplicate. C′, complement; absence of killing arbitrarily assigned as 1% killing. Dilutions of polyclonal antibodies and amounts (in μg) of MAb to PNAG tested are provided at the top of each bar.

