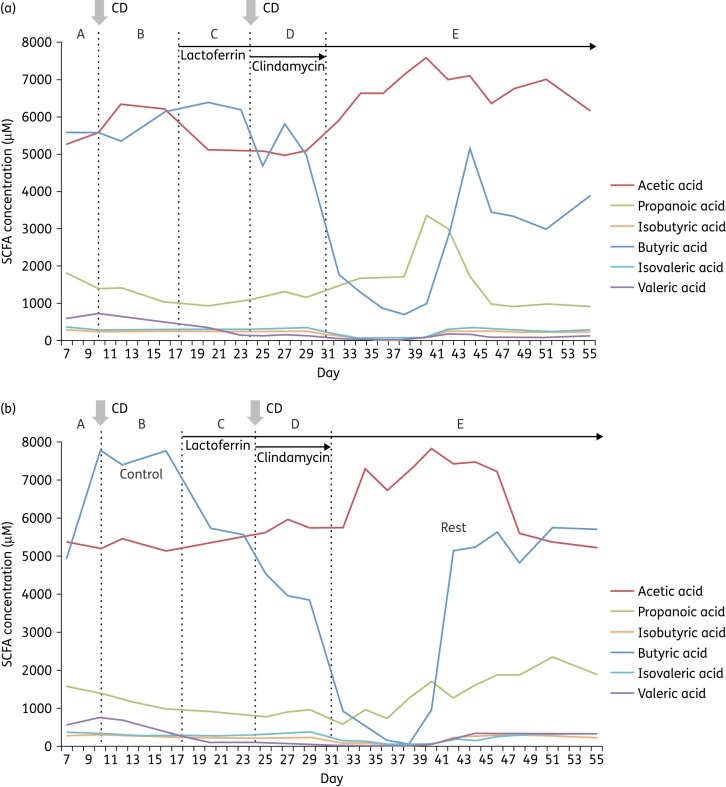
Figure 4.
SCFA concentration in vessel 3 of the (a) apo-lactoferrin and (b) holo-lactoferrin models by GC-MS. CD indicates insertion of C. difficile spores. A–E indicate experimental stages (see the Materials and methods section). This figure appears in colour in the online version of JAC and in black and white in the print version of JAC.

