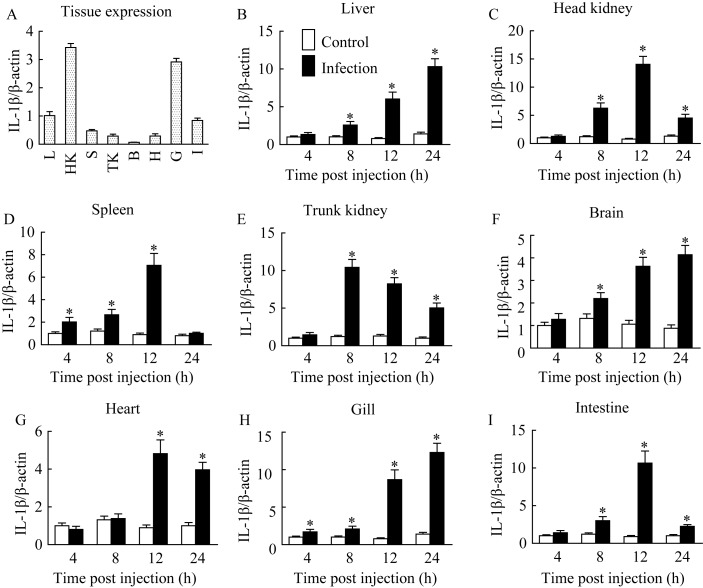
Figure 3.
QPCR analysis of the relative mRNA expression of LcIL-1β in different tissues of healthy (A) and V. alginolyticus-challenged large yellow croaker (B-I) A: tissue expression profile of LcIL-1β in healthy fish. L: liver; HK: head kidney; S: spleen; TK: trunk kidney; B: brain; H: heart; G: gill; I: intestine. Results from three fish are expressed as means±SEM. *: P<0.05 versus PBS group.

