Figure 4.
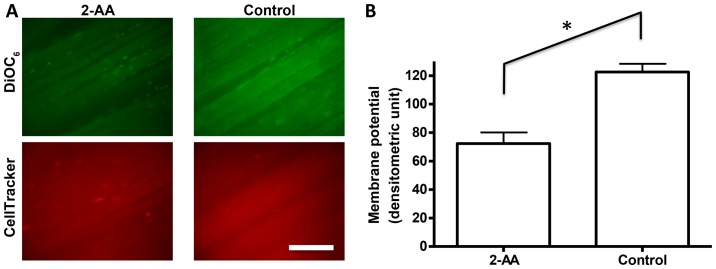
2-Aminoacetophenone (2-AA) reduces mitochondrial membrane potential in murine skeletal muscle. Mitochondrial membrane potential was analyzed by in vivo microscopy. (A) In vivo fluorescence microscopic images are shown both for 2-AA-treated (left column) and untreated (right column) groups. Green fluorescence (top panel) from 3,3′-dihexyloxacarbocyanine iodide (DiOC6) staining represents mitochondrial membrane potential, and red signal (bottom panel) from CellTracker Orange staining is for internal control staining. The white scale bar at the bottom represents 200 μm. (B) The average fluorescence signal was quantified by densitometry and shown as a bar graph with the standard error of the means. 2-AA-treated group showed a significantly decreased signal as compared to the controls. *p<0.05, according to Student's t-test.

