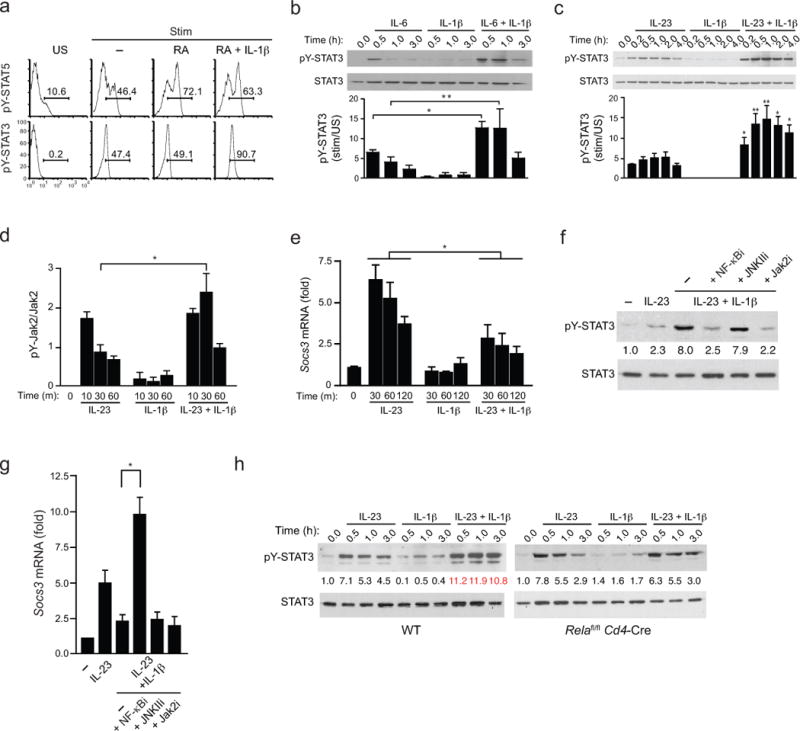
FIGURE 5. NF-κB-dependent SOCS3 repression by IL-1β enhances amplitude and duration of STAT3 phosphorylation.

(a) Intracellular pSTAT5 and pSTAT3 analysis from naïve CD4+ T cells from WT B6 mice that were activated with plate-bound anti-CD3 and soluble anti-CD28 under TH17 polarizing conditions (IL-6 +TGF-β with or without the indicated additions of RA and IL-1β for 4 days. Prior to analysis, IL-6 and IL-2 were added to cultures for 20 min and intracellular pSTAT5 and pSTAT3 were determined by flow cytometry. (b) Expression of phospho-tyrosine(705)-STAT3 (pY-STAT3) from naïve CD4+ T cells cultured under TH17 polarizing conditions for 4–5 days, then restimulated with IL-6 alone, IL-1β alone, or both for indicated time periods. Cell lysates were harvested, immunoblotted with antibody directed against phospho-tyrosine(705)-STAT3 (pY-STAT3) or total STAT3 (top). (c) Expression of phospho-tyrosine(705)-STAT3 (pY-STAT3) by immunoblot from naïve CD4+ T cells that were cultured under TH17 polarizing conditions for 4 days, then restimulated with IL-23 alone, IL-1β alone, or both for indicated time periods and assessed as in b. (d) Quantitative analysis of active phosphorylated form of Jak2 from naïve CD4+ T cells that were cultured for under TH17-polarizing conditions and activated as in c, then lysed and subjected to ELISA analysis that quantified both the active phosphorylated form of Jak2 [Jak2(pYpY1007/1008)] and total Jak2. pYpY-Jak2 values were normalized to total Jak2 expression and data are expressed as fold change over unstimulated TH17 cells where unstimulated cells were assigned a value of 1. (e) Expression of Socs3 transcripts by quantitative RT-PCR from naïve CD4+ T cells that were cultured under TH17 conditions as in c and restimulated with IL-23 and/or IL-1β for the indicated times. Transcript abundance of Socs3 were normalized against β2-microglobulin and relative expression compared to unstimulated cells was calculated using the ΔΔCt method. (f) Expression of phospho-tyrosine(705)-STAT3 (pY-STAT3) by immunoblot from naïve CD4+ T cells polarized under TH17 conditions were isolated and pre-treated with indicated signaling inhibitors for 1 h then either left unstimulated or treated with IL-23 +/− IL-1β before cell lysates were harvested and immunoblotted for pY-STAT3 and total STAT3 as in c. Average values of pooled data representing relative expression of IDVs of pY-STAT3 normalized to total STAT3 are shown (between upper and lower panels). (g) Expression of Socs3 transcripts by quantitative RT-PCR from naïve CD4+ T cells polarized under TH17 conditions were isolated, pre-treated with the indicated signaling inhibitors for 1 h, were then restimulated with IL-23 and/or IL-1β for 45 min and harvested for RNA isolation and Socs3 mRNA quantification as in e. (h) Expression of phospho-tyrosine(705)-STAT3 (pY-STAT3) by immunoblot from naïve CD4+ T cells from WT and Relafl/fl.Cd4-Cre mice were polarized and analyzed as in c. Average values of pooled data representing relative expression of IDV of pY-STAT3 normalized to total STAT3 are shown (between upper and lower panels). Data are: representative of one of two similar experiments a; representative of one of three similar independent experiments (b,c); pooled from two independent experiments with six samples (n = 6) per group d; three independent experiments with nine samples (n = 9) per group e; pooled from two independent experiments with nine samples (n = 9) per group g; representative of one of two similar independent experiments (f,h) where numbers in red (IL-23 + IL-1β) are significantly different (P < 0.01) from corresponding values for cells stimulated with IL-23 alone (mean and s.e.m. in b,c,d,e,g). * P < 0.05 and ** P < 0.01 (two-tailed unpaired t-test).
