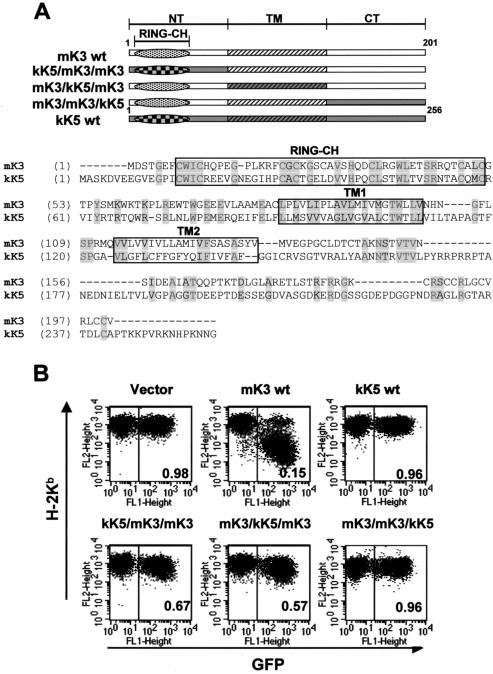
FIG. 3.
Replacement of the N-terminal (NT), TM, or C-terminal (CT) domain of mK3 with analogous domains of kK5 affects surface downregulation. (A) Schematic description and nomenclature of mK3 chimeras with KSHV kK5 (upper portion). An alignment of mK3 and kK5 sequences is shown in the lower portion. The numbers indicate the first and last amino acids for full-length mK3 or kK5. (B) Each mK3 chimera was introduced into B6/WT3 cells by using the pMIG vector. An analysis of surface Kb expression versus GFP fluorescence is shown. The number in each plot represents the ratio of Kb staining intensities between GFP+ and GFP− populations. Analysis of Db yielded very similar results (data not shown).

