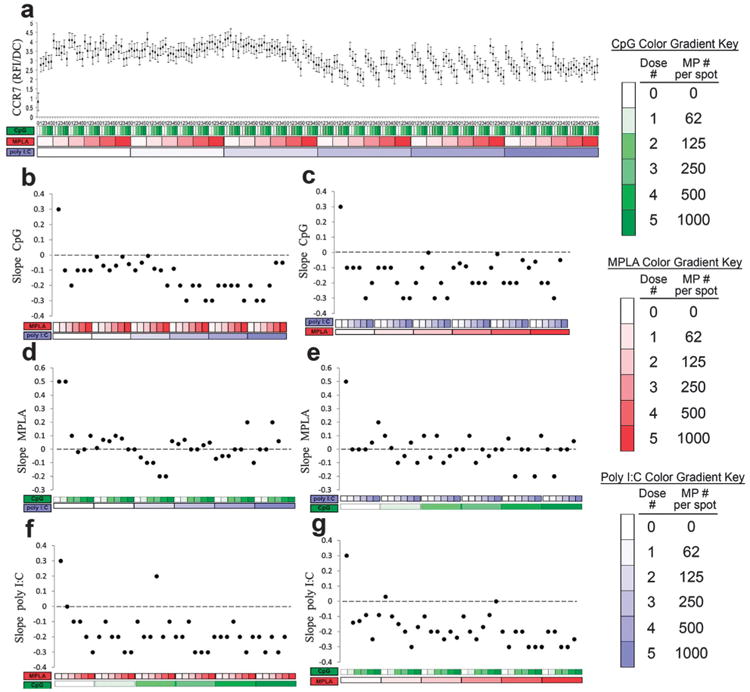
Fig. 11.

Analysis of dendritic cell (DC) CCR7 expression in response to combinatorial adjuvant-loaded microparticles (MPs). (a) CCR7 expression per cell is plotted against varying amounts of three MP-encapsulated adjuvants (CpG, MPLA and poly I:C; n = 9, with 3 replicates per array on 3 separate arrays). Data is arranged by grouping increasing particle numbers of CpG (green), MPLA (red), and lastly poly I:C (blue) with doses of 0, 62, 125, 250, 500 and 1000 particles per spot, represented by increased shading from lighter to darker colors. (b and c) Linear fits were calculated for each set of CpG dosing range (lowest to highest number of particles) for every combination of MPLA (red) and poly I:C (blue) doses. The slope of each linear fit was then calculated and plotted as a function of MPLA and poly I:C doses. Dotted lines represent a slope of zero. (d and e) The adjuvant formulations were then reorganized for every combination dose of CpG and poly I:C. Linear fits were created for the slope of the MPLA response associated with the specific dose of CpG and poly I:C. The slope of each linear fit was then calculated and plotted as a function of CpG (green) and poly I:C (blue) doses. Dotted lines represent a slope of zero. (f and g) The adjuvant formulations were then reorganized for every combination dose of CpG and MPLA. Linear fits were created for the slope of the poly I:C response associated with the specific dose of CpG and MPLA. Linear fits were calculated for each set of poly I:C dosing range. The slope of each linear fit was then calculated and plotted as a function of CpG (green) and MPLA (red) doses. Dotted lines represent a slope of zero.
