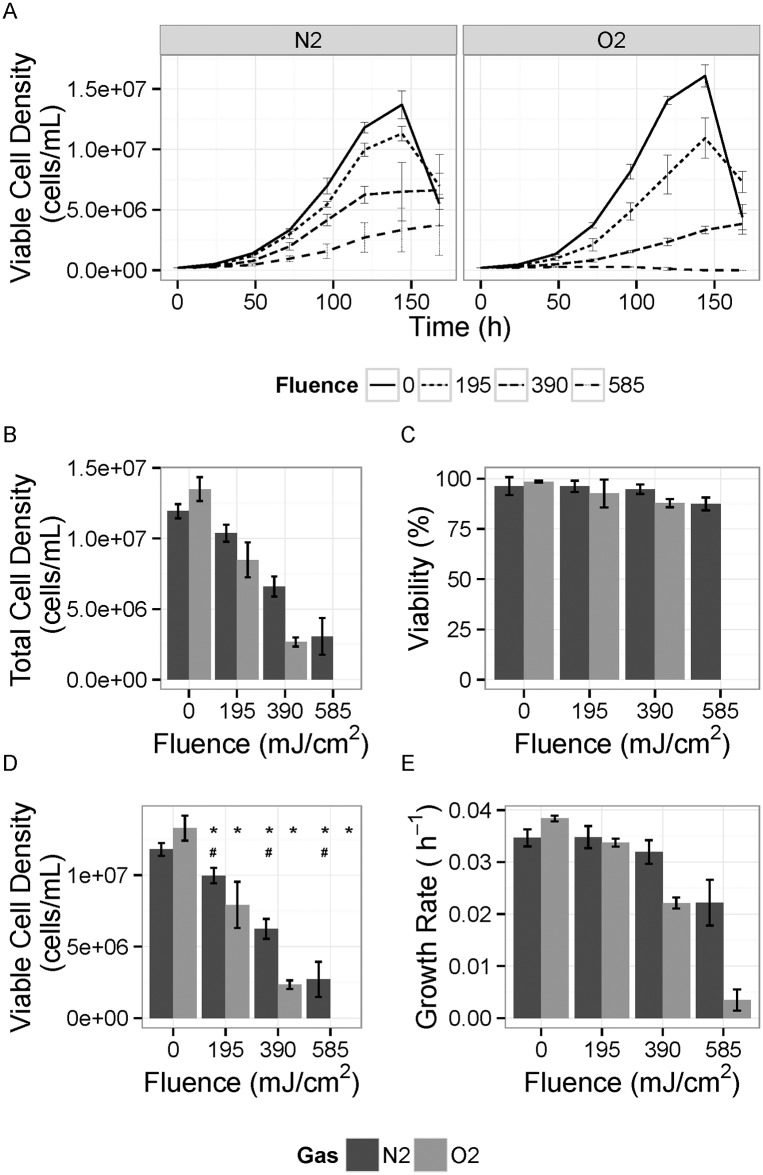
Fig 6. Comparison of the cell culture performance.
A) Time-course of viable cell density for cells grown in different fluence UV-treated nitrogen-saturated (N2) or oxygen-saturated media (O2) media. B) Total cell densities reached on Day 5 (end of exponential phase for most cultures). C) Viability of cells on Day 5. D) Total viable cell density. E) Growth rate during exponential growth phase (Days 1 through 5). The error bars represent the standard deviation for N = 6. *—Significant difference when compared to control for the same gas treatment group. #—Significant difference between N2- and O2-saturated groups at an individual fluence level.

