Figure 4.
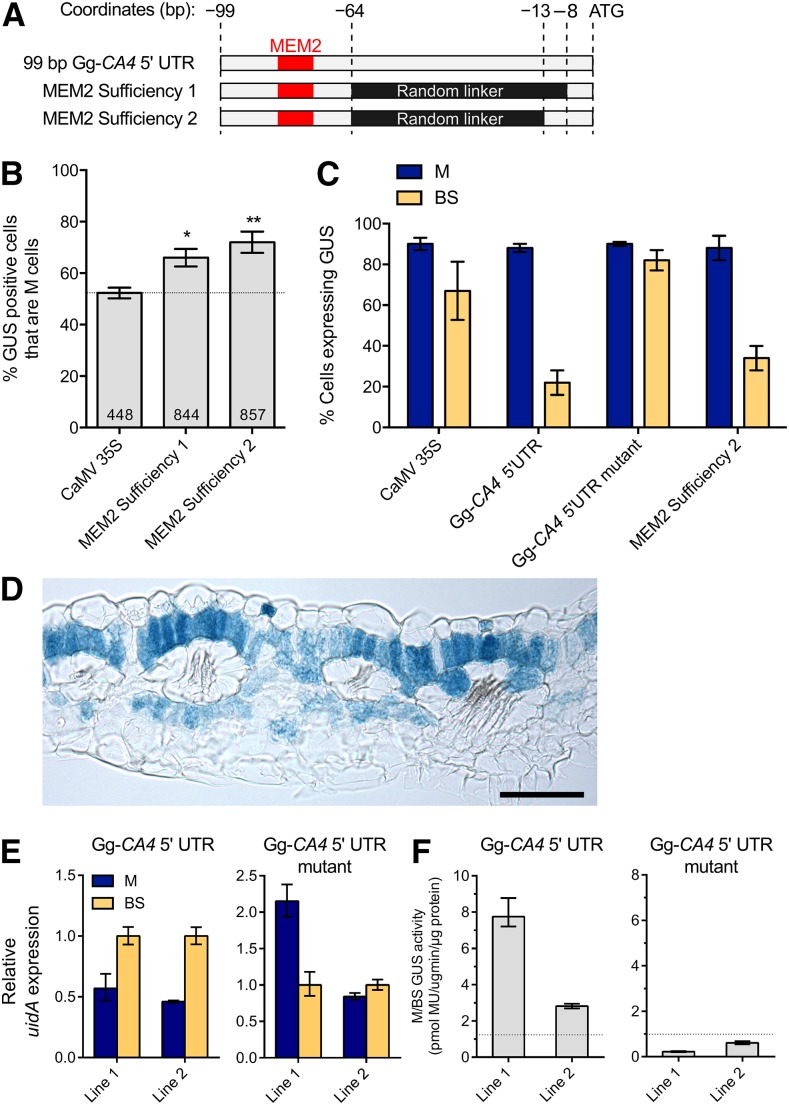
MEM2 Confers Equal Transcript Abundance in M and BS Cells.
(A) and (B) Two chimeric constructs were synthesized by placing the nucleotides preceding the start codon of Gg-CA4 downstream of MEM2 (red; [A]) and tested using microprojectile bombardment (B). Numbers within histogram bars represent the number of independently transformed cells for each construct. Results from microprojectile bombardment were validated by generating three stable transgenic lines. Error bars represent one se. *P < 0.01, **P < 0.001, two-tailed Student's t test.
(C) The percentage of GUS positive M and BS cells was quantified in stable lines expressing the Gg-CA4 5′ UTR (three lines), Gg-CA4 5′ UTR mutant (three lines), MEM2 Sufficiency 2 (two lines), and the CaMV35S promoter (four lines) fused to uidA. Error bars represent one se.
(D) A representative transverse section expressing MEM2 Sufficiency 2. Bar = 100 µm.
(E) RT-qPCR quantification of uidA transcripts from M and BS cells expressing uidA under the control of the endogenous and mutated Gg-CA4 5′ UTR. Error bars represent one se. Three technical replicates were performed for each line and cell type.
(F) The activity of GUS measured by the rate of MU synthesis in the same cell fractions, expressed as fold enrichment in M cells versus BS cells. Error bars represent one se. Three technical replicates were performed.

