Figure 5.
Stomatal Response of the slac1-2 Mutant Expressing SLAC1 Proteins Containing a Single Amino Acid Substitution.
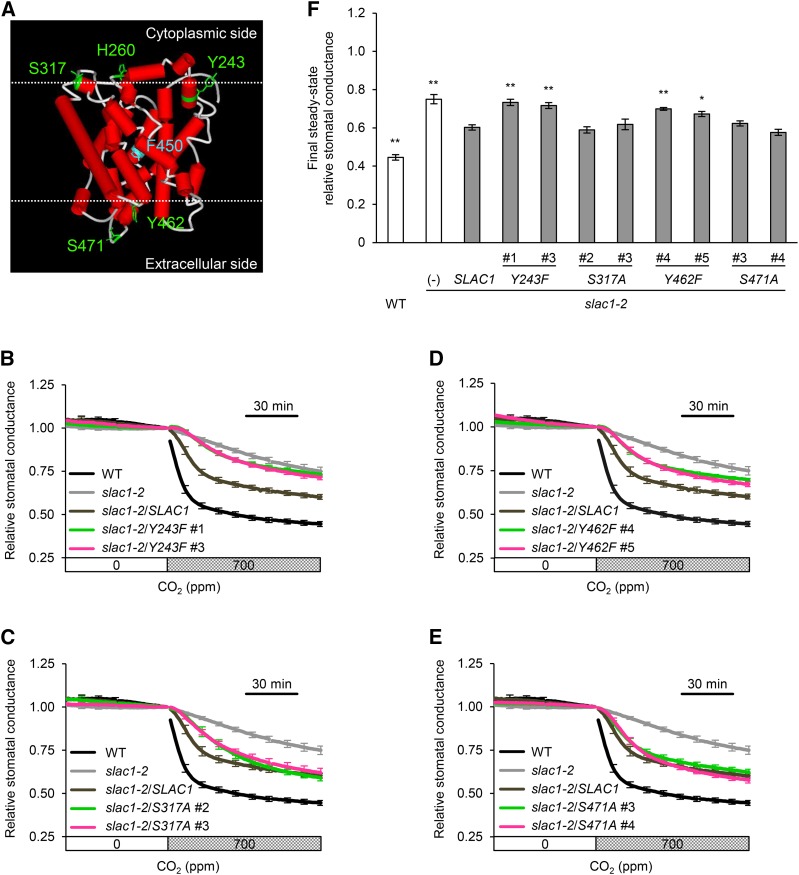
(A) Structural model of the transmembrane region of SLAC1 (amino acids 180 to 507) generated by homology modeling using Modeler (Fiser and Sali, 2003). The crystal structure of HiTehA, a bacterial homolog (Haemophilus influenza) of SLAC1 (PDB ID 3M72), was used as the template for the modeling according to Chen et al. (2010). The substituted amino acids are shown in green. Serine (S) was substituted with alanine (A). Tyrosine (Y) and histidine (H) were substituted with phenylalanine (F). Phe-450 (F450) that has been reported to gate a central five-helix transmembrane pore of SLAC1 is shown in blue. The cytoplasmic and extracellular membrane surfaces were predicted according to Spassov et al. (2002) and are depicted in upper and lower dotted lines, respectively.
(B) to (E) Time-resolved relative stomatal conductance response to [CO2] in the transgenic lines expressing mutant SLAC1 protein Y243F (B), S317A (C), Y462F (D), and S471A (E). The wild type (black), slac1-2 mutant (light gray), and wild-type SLAC1 complementation line (dark gray) control traces are the same in (B) to (E). Two independent transgenic lines per construct (magenta or green) were analyzed. Plants were kept under constant white light of 150 µmol m−2 s−1 at 22°C in 45% relative humidity. Conductance was normalized to the average conductance at the last 0 ppm data point. Error bars indicate ± se; n = 5 to 7.
(F) Final steady state relative stomatal conductance of the transgenic lines. Asterisks denote comparison with wild-type SLAC1 complementation line: **P < 0.05 and *P < 0.1 by one-way ANOVA with Dunnett's post hoc test.

