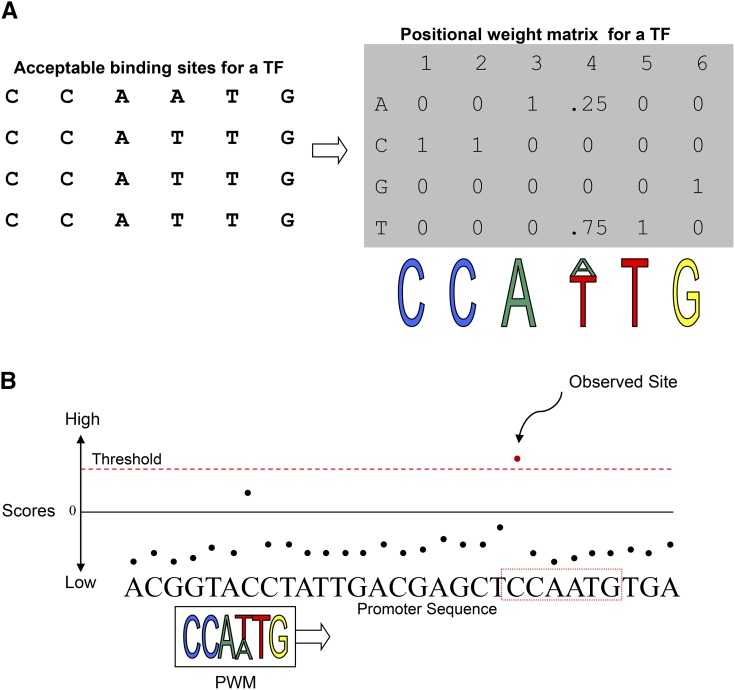
Figure 3.
TFBS Log-Likelihood Scanning with a PWM.
(A) Given a collection of sequences that represent observed binding sites for a TF, a PWM “counts up” the number of As, Cs, Gs, and Ts in each position to describe the chance of finding each nucleotide in this position. The PWM can be visualized as a “logo” that describes how often the TF is expected to bind certain types of sites.
(B) An illustration to visualize scanning for binding sites: Only those sites in a promoter sequence that exceed the PWM-specific threshold score are “observed” as putative binding sites.
(Adapted from Megraw and Hatzigeorgiou [2010], Figures 1 and 4, for [A] and [B], respectively. Springer Plant MicroRNAs, Methods in Molecular Biology, Chapter 11, Vol. 592, 2010, pp. 149–161, Megraw and Hatzigeorgiou, © Humana Press a part of Springer Science + Business Media, LLC 2009, with permission of Springer.)

