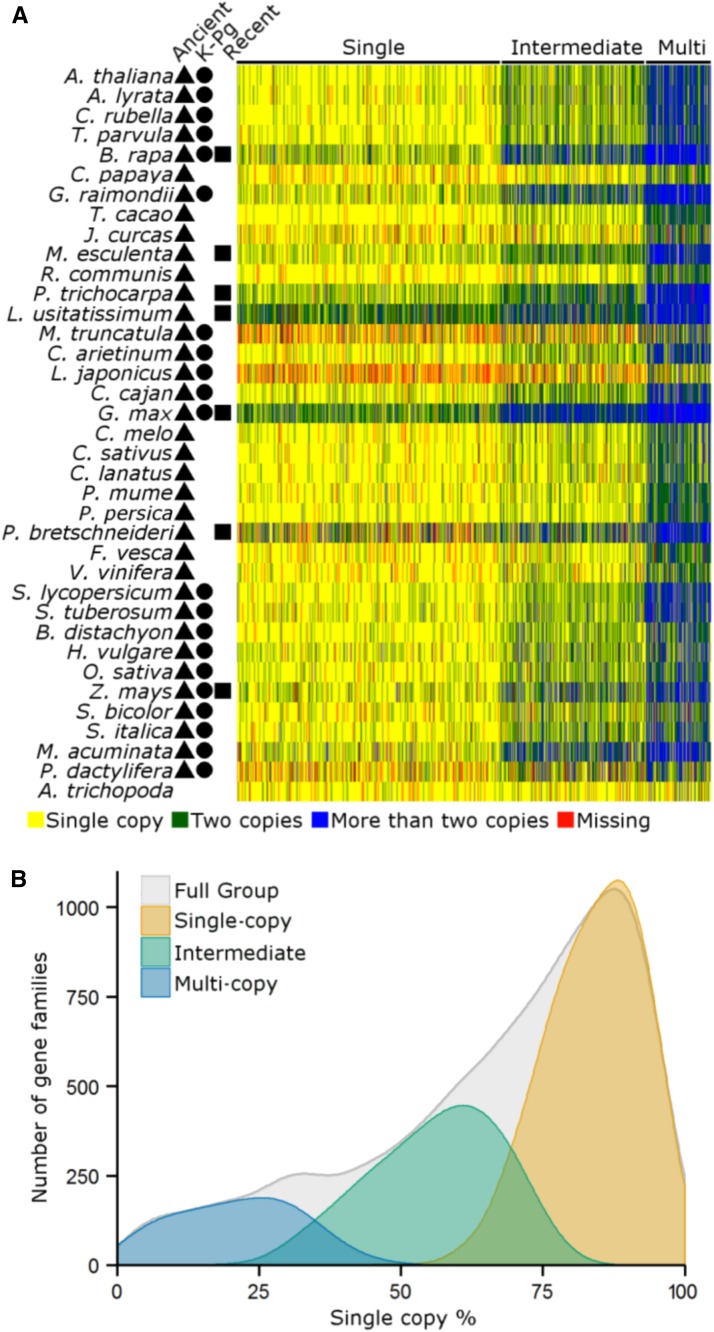
Figure 4.
Core Gene Families Partition into Three Groups Based on Clustering of the Copy-Number Profile Data.
(A) Heat map of the clustered copy number profile matrix. Rows represent species and columns represent the core gene families. Gene families (columns) are sorted according to the three different groups obtained by k-means clustering. Symbols indicate for each species whether WGD events that might have contributed to duplicates in the species fall into the “recent” (rectangle), “K-Pg boundary” (circle), or “ancient” (triangle) category.
(B) SCP distributions for the gene families in each of the three different groups. The distribution of the Full Group shows the SCP distribution of all core gene families together (cf. Figure 2).

