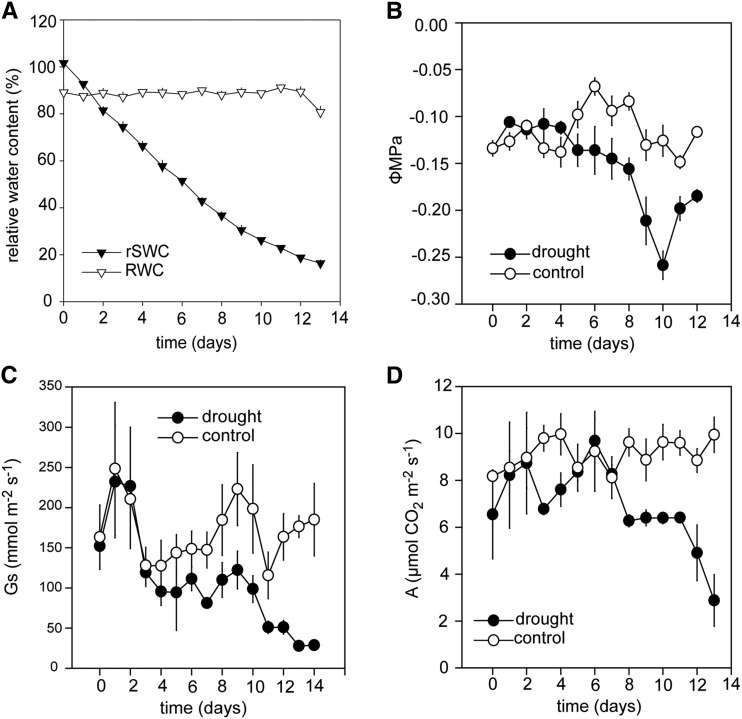
Figure 1.
Plant Responses during a Progressive Drought Experiment.
(A) RWC (open triangles) and rSWC (closed triangles) during a 13-d drying period. The data represent the mean (n = 6; ±se).
(B) Leaf water potential in well-watered (open circles) and drought-stressed (closed circles) plants during a 13-d drying period. The data represent the mean (n = 5; ±se).
(C) Stomatal conductance of well-watered (open circles) and drought-stressed (closed circles) plants, measured at the prevailing growth conditions (see Methods). The data represent the mean (n = 6; ±se).
(D) Carbon assimilation of well-watered (open circles) and drought-stressed (closed circles) plants, measured at the prevailing growth conditions (see Methods). The data represent the mean (n = 6; ±se).

