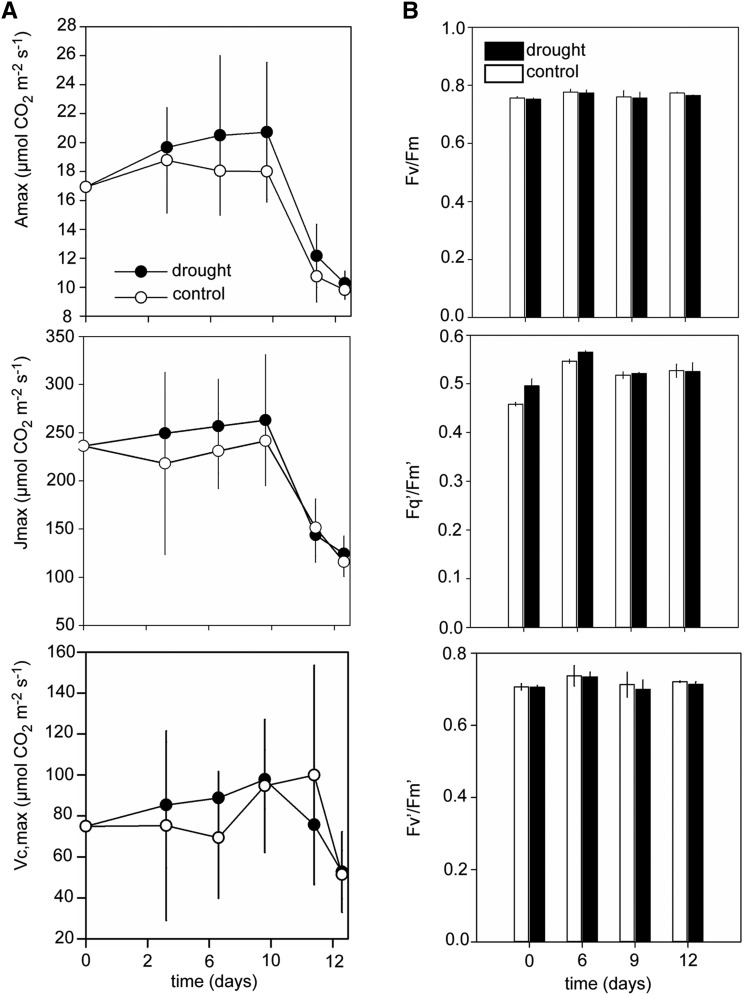
Figure 2.
Potential Photosynthesis in Response to Drought.
(A) A/Ci curves were performed under saturating light conditions of 1000 µmol m−2 s−1 at six selected time points throughout the drying period, and potential photosynthesis was calculated, including light and [CO2]-saturated net CO2 assimilation (Amax), maximum rate of RuBP regeneration (Jmax), and maximum rate of carboxylation (VCmax).
(B) Maximum and operating quantum efficiencies of photosystem II (Fv/Fm, Fq′/Fm′, and Fv′/Fm′). The data represent the mean (n = 3; ±se).

