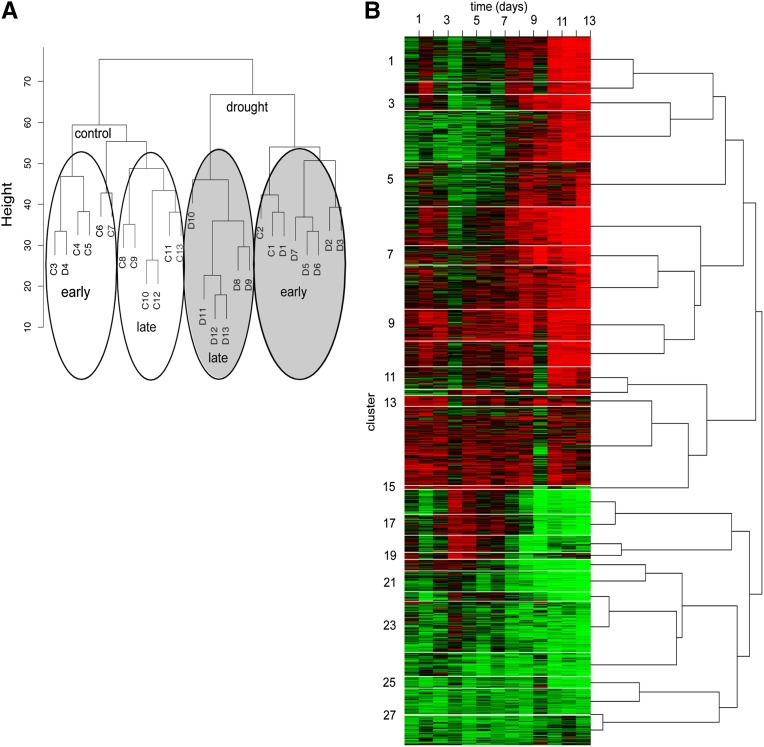
Figure 6.
Temporal Clustering of 1815 Differentially Expressed Genes.
(A) Dendrogram of the hierarchical clustering using a Euclidian distance divides the data set into early and late responses for both the control (white circles) and drought (gray circles) samples.
(B) Heat map of the SplineCluster analysis of the 1815 DEGs on differentially expressed genes (drought samples only) across the time series using normalized and averaged data (Supplemental Data Set 11). The heat map demonstrates expression profiles for genes in each cluster with red representing high expression and green representing low expression.

