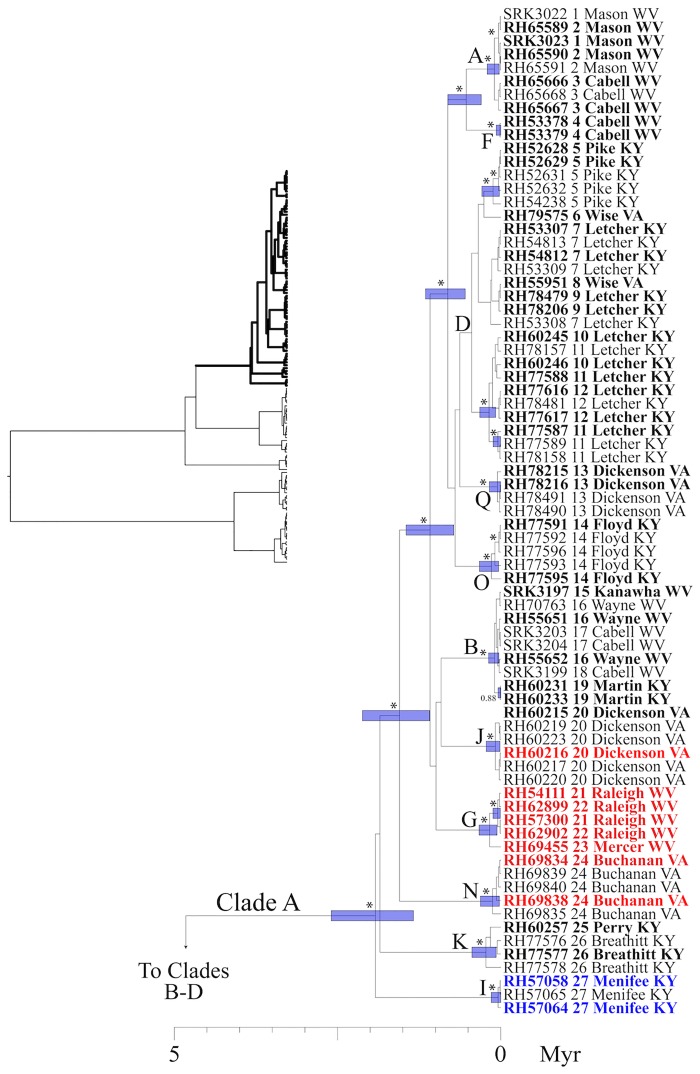
Fig 3. Bayesian maximum clade credibility tree.
This phylogeny was inferred using concatenated mtDNA data (Cyt-b, ND2, tRNAtrp, tRNAala). Taxon labels include specimen identification number, the population numbers from Fig 1, and county plus state information. Numbers adjacent to nodes are posterior probabilities (pp), and asterisks identify nodes with pp ≥ 0.95. Bars indicate 95% confidence intervals (CI) for dates of nodes. For visual clarity, many pp values and CI bars were removed near the tips of the tree. Specimens in the "complete" data set, which includes five nuclear loci in addition to mtDNA, are highlighted in bold. The bGMYC analysis delimited either 17 putative species, or two putative species, depending on the probability threshold employed (see text). The 17 putative species are identified using the letters (A-Q) adjacent to nodes; the two putative species are represented by Clade A, and Clades B-C. Finally, three putative species delimited in the Geneland analysis are highlighted using colored text that is either black (species A), red (species B), or blue (species C). Clade A is here illustrated. The entire phylogeny is illustrated in the upper left, with Clade A illustrated using bold lines. See Fig 4 for Clades B-D.

