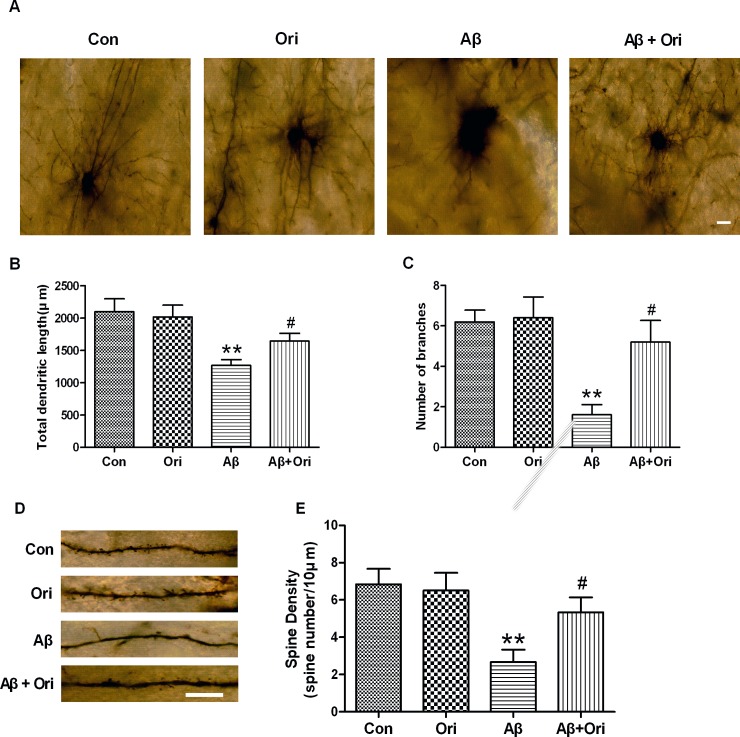
Fig 3. Effects of Ori on the total dendritic length, number of branches and spine density in the hippocampus of AD mice.
(A) Representative dendritic images from the hippocampus of mice. Scale bar = 20 μm. (B) Quantitative analysis of the total dendritic length. (C) Quantitative analysis of the number of branches. (D) Representative dendritic spine images from the hippocampus of mice. Scale bar = 10 μm. (E) Quantitative analysis of spine density. Six neurons from each brain were selected for analysis and 6 mice were used from each group. Data are presented as the means ± SEM. *P<0.05, **P<0.01 vs. control; #P<0.05, ##P<0.01 vs. Aβ1–42.

