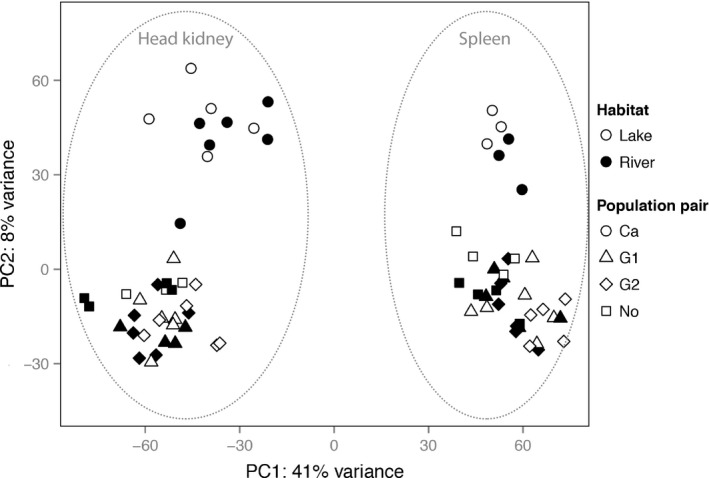
Figure 1.

Principal component analysis (PCA) of gene expression profiles based on all genes after filtering out weakly expressed genes (See Methods). Head kidney samples and spleen samples are separated along the x‐axis, and the Canadian samples are separated along the y‐axis. PCA axes explain 41% (x‐axis) and 8% (y‐axis) of the total variation.
