Figure 5.

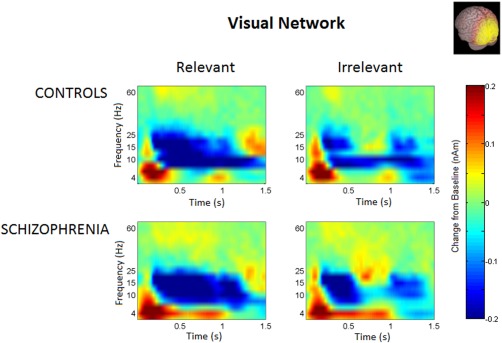
Time frequency spectrograms for the visual network, by group, and relevance condition. [Color figure can be viewed in the online issue, which is available at http://wileyonlinelibrary.com.]

Time frequency spectrograms for the visual network, by group, and relevance condition. [Color figure can be viewed in the online issue, which is available at http://wileyonlinelibrary.com.]