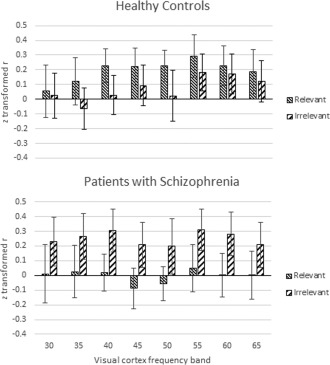
Figure 6.

Correlations between insula integrative beta and visual gamma. The height of the bars shows the mean z‐transformed correlation between the inferred insula integrative beta signal and 8 overlapping gamma band oscillations from primary visual cortex, centered on the frequencies shown. Error bars are standard errors. Overall, the correlations were significantly positive, with correlations for relevant trials in the healthy group being statistically significant at p = 0.008.
