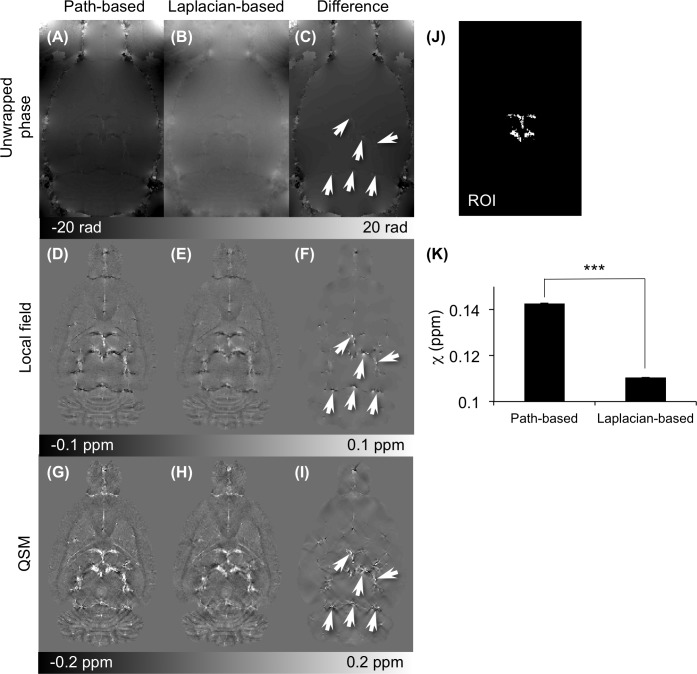
Fig 4. Comparison of quantitative susceptibility map (QSM) based on path-based and Laplacian-based phase unwrapping.
Images computed using 3D path-based and Laplacian-based phase unwrapping are presented in the first and second columns from the left. The third column depicts the difference in the images in the first two columns. (A-C) Comparison of the unwrapped phase images with path-based and Laplacian-based algorithms. (D-F) Comparison of the local field (SHARP filtering with radius of 3 voxels). (G-I) Comparison of reconstructed QSM (L1 regularization with λ = 10−3). The arrows point to regions where significant differences between the images in the left and middle columns were observed. (K) Comparison of the measured susceptibility values in vessels from (J) the region-of-interest (ROI) (***p < 0.001).

