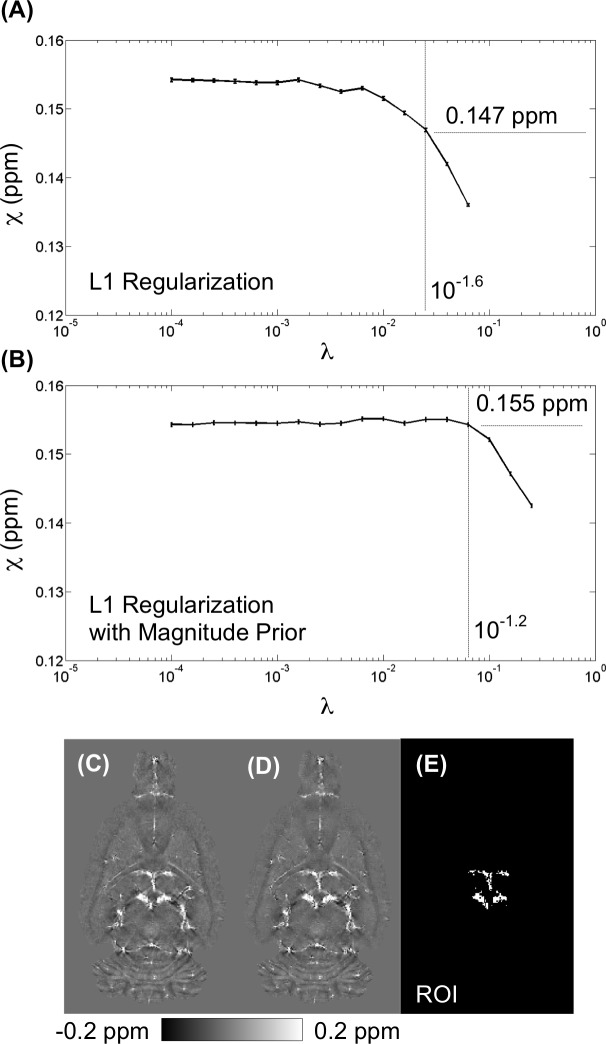
Fig 5. Influence of the Selection of the Lagrange parameter λ.
Plot of the measured susceptibility value from region-of-interest (E) across various λ by (A) L1 regularization and (B) L1 regularization with magnitude prior. At optimal weighting of λ = 10−1.6, L1 regularization resulted in 0.147 ppm. In contrast, at optimal weighting of λ = 10−1.2, L1 regularization with magnitude prior resulted in 0.155 ppm.

