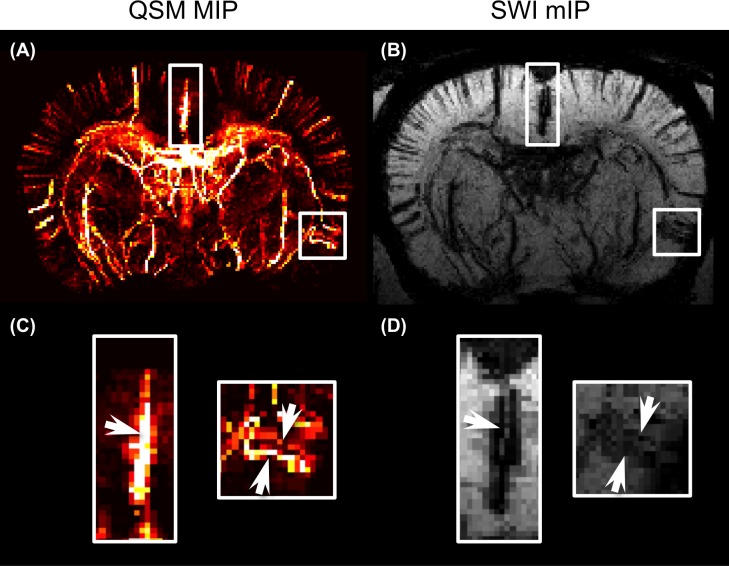
Fig 7. Comparison of QSM and susceptibility-weighted imaging (SWI).
(A) A 2.5-mm-thick MIP of QSM in axial view. The cortex in dorsal and lateral brain are marked by the rectangles and magnified in (C). (B) A 2.5-mm-thick minimum intensity projection (mIP) of SWI with identical ROIs. (D) In the mIP of SWI, the vein has blooming artifacts and is difficult to identify. The arrows point to the significant difference between QSM and SWI.

