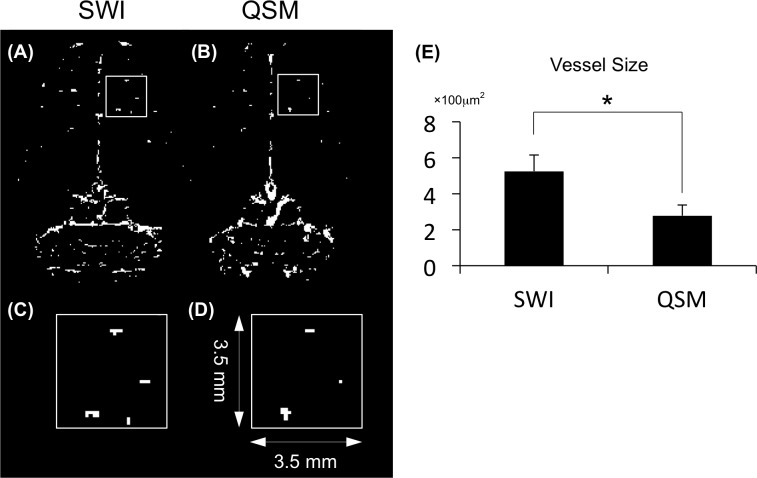
Fig 8. Illustration of differences in the intracortical penetrating vessels between SWI and QSM.
(A) A coronal slice from SWI. (B) A coronal slice from QSM. (C) Magnified view of a 3.5 × 3.5-mm2 region of SWI marked by red rectangle in A. The bright signal represents the through-plane cortical vessels. (D) Fewer and smaller bright signals in QSM. (E) Quantification of vessel size using the two methods. (*p < 0.05).

