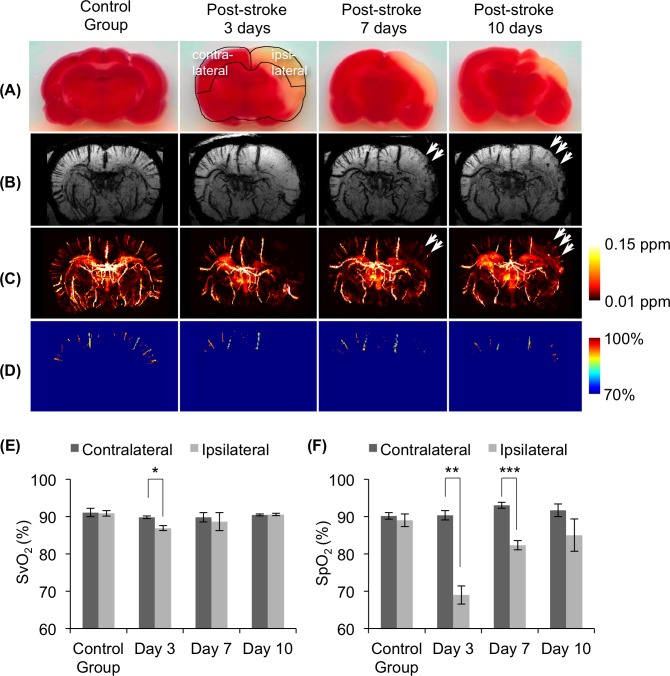
Fig 9. Detection of the rehabilitation of intracortical venules in the rat brain after stroke.
(A) Triphenyl tetrazolium chloride (TTC)-stained slice for infarcted cortical area confirmation over time. (B) Representative of 2.5-mm-thick minimum intensity projection (mIP) of SWI over time. (C) Representative of 2.5-mm-thick average intensity projection (AIP) of QSM over time. (D) Representative of 2.5-mm-thick SvO2 map over time. The second figure in the first row illustrates the ROI selections on the contralateral (left) and ipsilateral (right) cortices. The arrows indicate angiogenesis at 7 and 10 days post-reperfusion. (E) (F) Comparison of SvO2 estimates and SpO2 measures on a post-stroke rat. (E) SvO2 estimates by QSM-mMRV and (F) SpO2 measures using the pulse oximeter on contralateral and ipsilateral cortices. (Mean and SD cross subjects are presented; *p < 0.05; **p < 0.01; ***p < 0.001).

