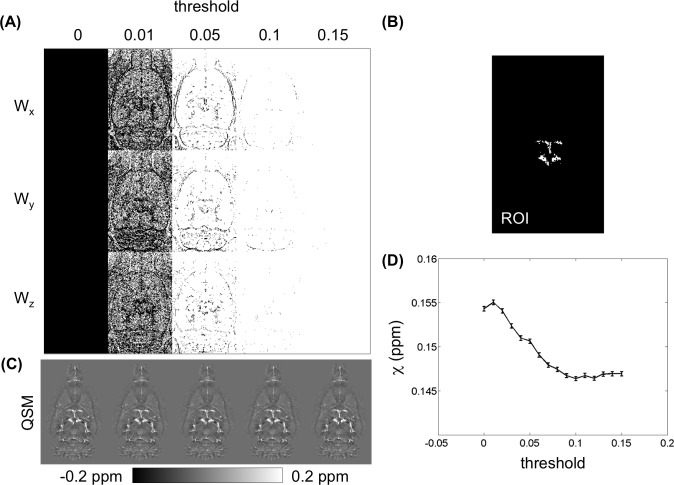
Fig 10. Influence of the selection of the prior information W.
(A) Illustrations of the binary weighting in three dimensions across different thresholds from 0 to 0.15 (Wx: weighting factor in x dimension; Wy: weighting factor in y dimension; Wz: weighting factor in z dimension;). (C) The reconstructed QSMs across different thresholds. (D) The susceptibility values measured from the region-of-interest (B) are the same as in Fig 4(J).

