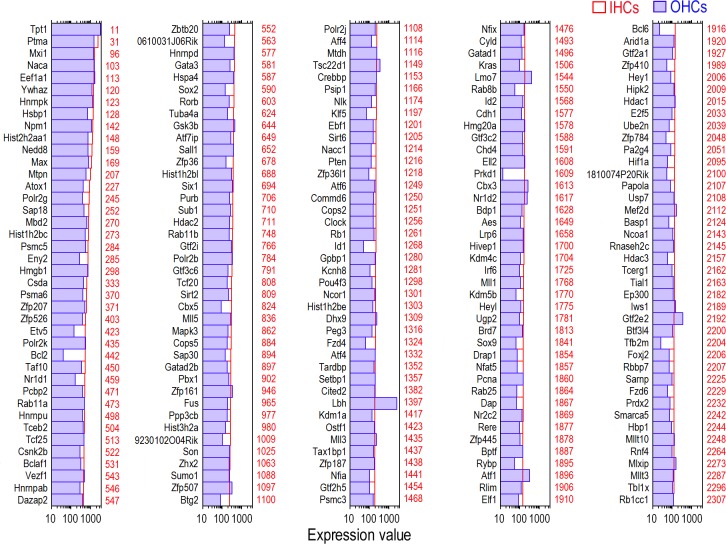
Fig 1. Expression levels of the top 200 TF genes in adult IHCs (in red) in descending order.
For comparison, the expression value of the same genes in adult OHCs (in blue) is also presented. Color-coded numbers on the right side of each panel represents the abundance ranking of the each TF among 16,647 transcripts considered to be expressed in adult IHCs.

