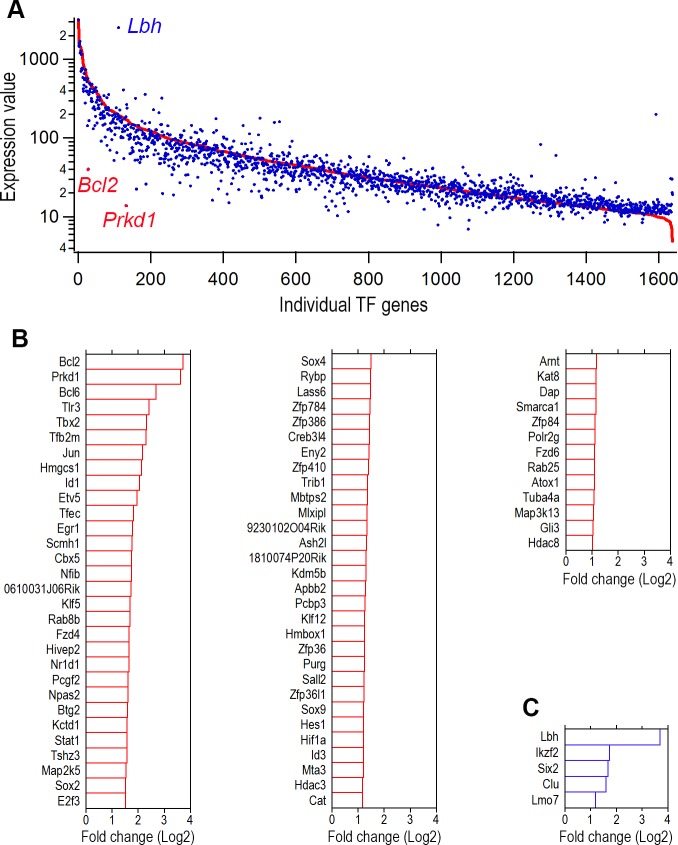
Fig 3. Differentially and uniquely expressed TF genes in adult IHCs and OHCs.
(A) All TF genes in IHCs and OHCs. The red line represents the expression level of all individual TF genes of IHCs while each blue dot represents the expression level of the same TF genes in OHCs. TF genes that are differentially expressed in OHCs are above the red line while genes that are differentially expressed in IHCs are below the red line. (B) Differentially expressed IHC TF genes with reference to the expression of same genes in OHCs (in Log2). (C) Differentially expressed adult OHC TF genes with reference to the expression of the same genes in IHCs. Only those whose expression levels differ by at least one Log2-fold between the two populations of cells are shown in B and C.

