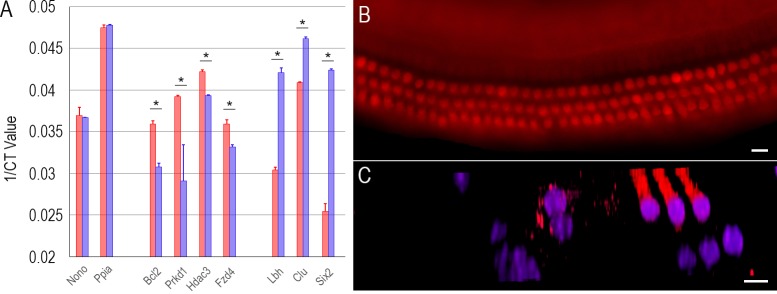
Fig 7. Validation of gene expression by qPCR and immunocytochemistry.
(A) Comparison of seven TF genes expressed in adult IHCs and OHCs using qPCR. Note that the ordinate is the inverse of the number of PCR cycles necessary to reach fluorescence threshold. So even a small change (such as 0.01) reflects a large difference. The asterisk represents statistical significance (p < 0.001, Student’s t-test) between each pair. (B) Fluorescence image of expression of LBH in the adult organ of Corti. (C) Optical sectioning of the organ of Corti using confocal microscopy. Nuclei were labelled with DAPI. Bar represents 10 μm.

