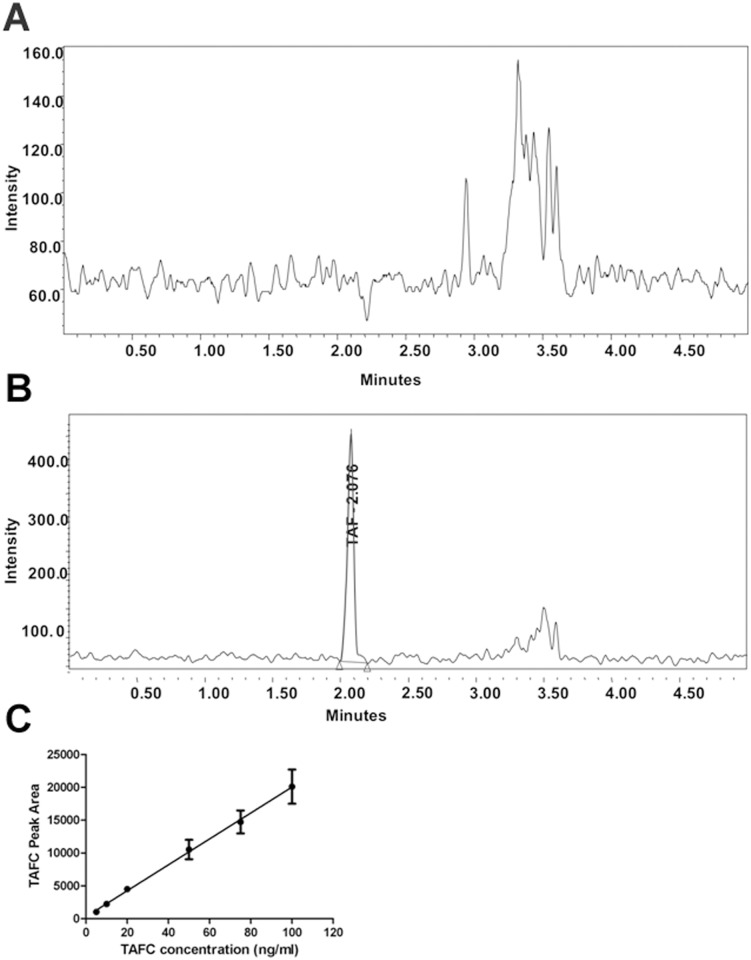
Fig 2. UPLC-MS/MS detection of TAFC.
A. Chromatogram of healthy serum without the addition of TAFC. B. Pure TAFC (5 ng/ml) was spiked into healthy serum, extracted and detected via UPLC-MS/MS. Note the difference in magnitude of the Y-axis. C. Representative standard curve of TAFC over a range of 1–100 ng/ml. The values represent the mean ±SD of n = 3 samples.

