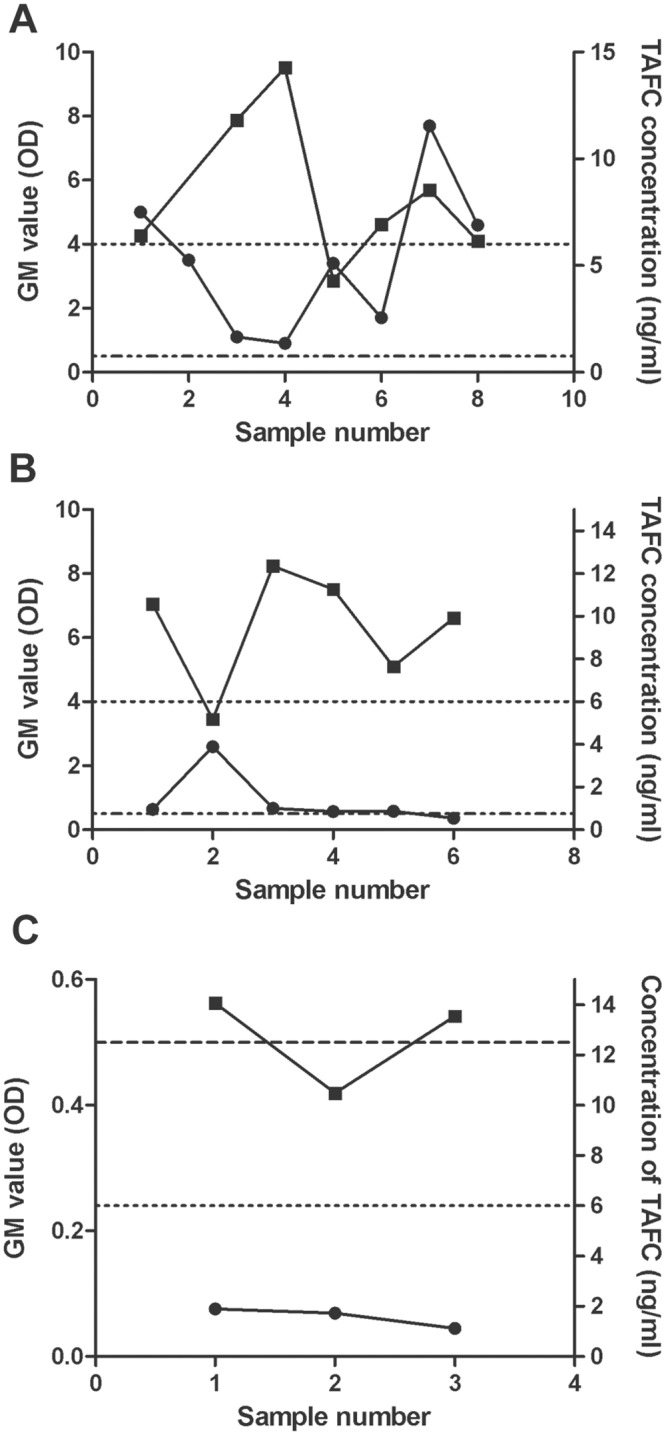
Fig 6. TAFC and GM values for serial samples from selected patients.

TAFC (black squares) and GM (black circles) values were determined for 3 patients (A), (B) and (C) over time. Detection limits are noted by the dashed line (GM) and the dotted line (TAFC). The interval between the samples for each patient averaged 13 days.
