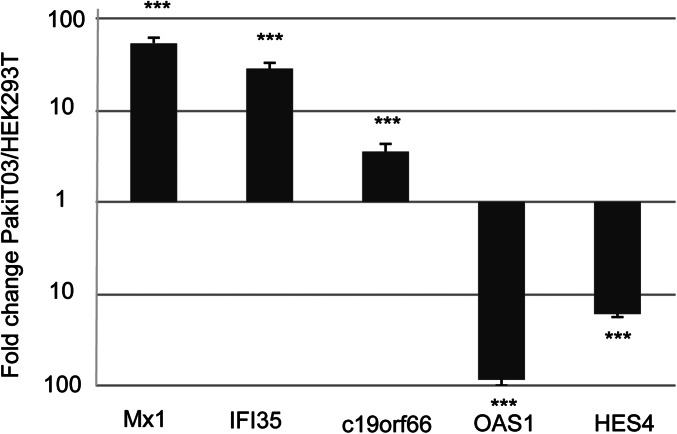
Fig. S4.
qRT-PCR detection of Mx1, IFI35, c19orf66, OAS1, and HES4 mRNA expression in uninfected PaKiT03 and HEK293T cells. Gene expression was calculated and compared by using the standard curve methods. The expression level was normalized to the housekeeping gene 18s rRNA. All values are the mean of at least three independent experiments, and error bars indicate SDs. Data represents the ratio of fold change in mRNA expression in PaKiT03 cells relative to HEK293T cells (***P < 0.001, one-tailed Student t test).

