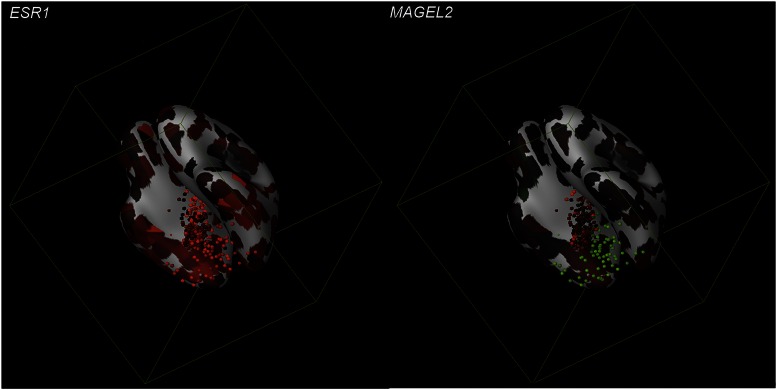
Fig. 1.
Three-dimensional gene expression in the human brain. The model shows the expression of ESR1 and MAGEL2 mapped onto a ventral view of a 3D-reference atlas reconstruction. The expression of these genes is indicated by the dots. The color of the dots indicates the expression level: green (low expression) through red (high expression). Images were produced by the Brain explorer 2 software application, an interactive version of the Allen Human Brain Atlas.

