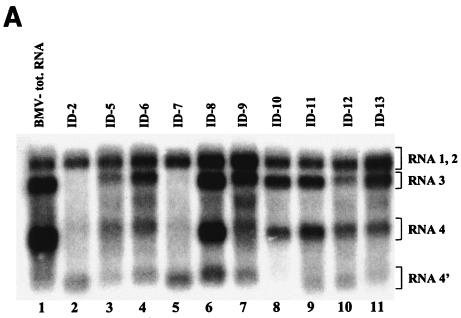
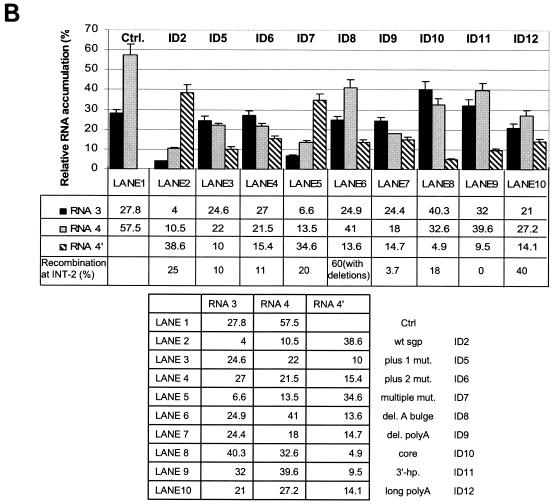
FIG. 3.
(A) Northern blot analysis of the accumulation of BMV RNA3 ID constructs. Leaves were coinoculated mechanically with in vitro-transcribed wt RNA1 and RNA2 and with RNA3 ID mutants (as indicated above the gel). Total (tot.) RNA was extracted from the infected tissue, separated electrophoretically in a 1% agarose-formamide-formaldehyde gel, and blotted to a nylon membrane (HybondN+; Amersham), and BMV RNA sequences were detected by using a 32P-labeled RNA probe that was complementary to an 83-nt fragment common to the 3′ ends of all four BMV RNAs (nt 1870 to 1953 on the BMV RNA3 positive strand). Lanes 2 to 11, RNAs extracted from the local lesion tissues of C. quinoa. Lane 1 (control), RNA from systemically infected barley seedlings. The positions of BMV RNA components are indicated on the right. (B) Histogram showing the quantification of the accumulation of RNA3 and sg RNA4 and RNA4′. The Northern blot autoradiogram shown in panel A was scanned in the PhosphorImager and subjected to computer-based densitometry by using the ImageQuant (version 5.0) program from Amersham Biosciences. Bars represent the percentages which the band intensities for RNA3, RNA4, and RNA4′ contributed to the total intensity of all BMV RNA components. The numbers below show the actual results of quantification and the observed recombination frequencies at INT-2 (as a reference; repeated from Table 1).


