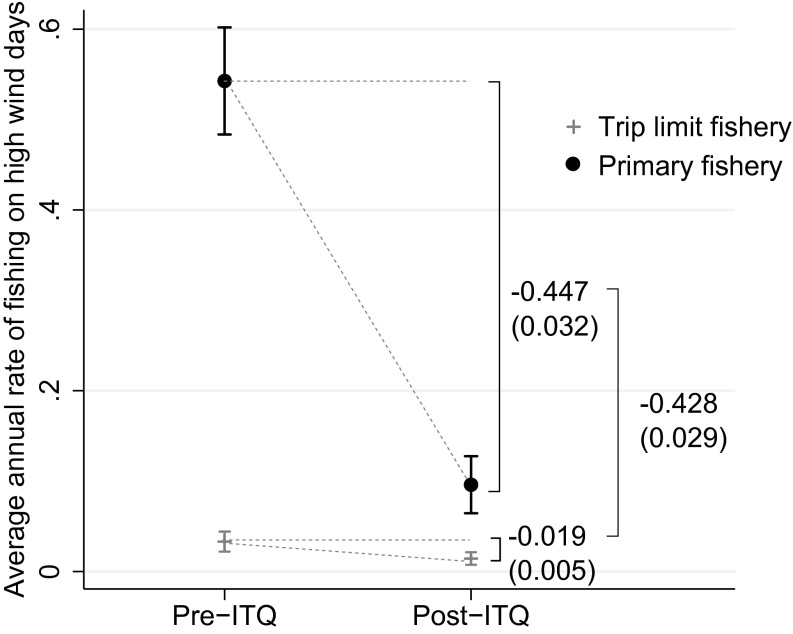
Fig. 2.
Change in the annual average rate of fishing on high wind days. Estimates result from difference-in-differences regression of the annual vessel average rate of fishing on high wind days. Individual fixed effects included. Bars show 95% CIs around the estimates. SEs in parentheses. Number of observations: 5,396. R2 = 0.50.

