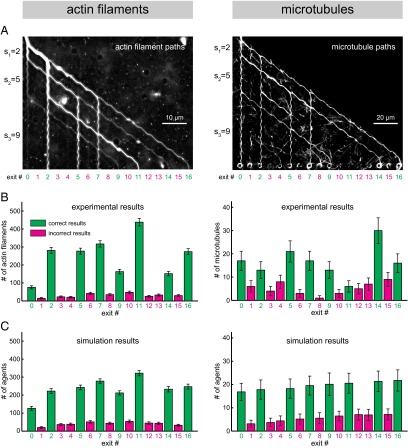
Fig. 4.
Solving the SSP {2, 5, 9} by actin filaments (Left) and microtubules (Right). (A) Average (Left) and maximum (Right) projections of several hundred typical fluorescence micrographs of actin filaments (Left) and microtubules (Right) moving through a {2, 5, 9} device. An example of the computation (for a device using actin filaments) is presented in Movie S2. (B) Experimental results obtained from 2,251 actin filaments (Left; total experiment time: 26 min) and 179 microtubules (Right; total experiment time: 180 min). Error bars represent the counting error (√n). Total experiment time refers to the time required for the given number of agents to enter and traverse the network (see also SI Appendix, section S1). We note that the overall performance of the microtubule device was to some extent inferior to the actin device due to an accidental obstruction in a channel leading to exit 11 (causing a lower number of filaments reaching this exit), and due to a number of filaments landing at random points of the network in the channels where they were transported with high probability by the processive kinesin motors (increasing the number of filaments reaching the wrong exits). Both issues will be remedied in a next generation of devices by avoidance of fabrication errors, working in a cleanroom environment, and microfluidic focusing of the filaments in solution to the landing zones, respectively (see also SI Appendix, section S6 for more details on these sources of error). (C) Monte Carlo simulation results (mean ± SD of 100 simulations; see SI Appendix, section S6 for simulation details) for actin filaments (Left) and microtubules (Right) using the actually measured error rates of the pass junctions and measured splitting ratios of the split junctions (Fig. 3C). In A–C, green numbers and bars represent correct results, and magenta numbers and bars represent incorrect results.

