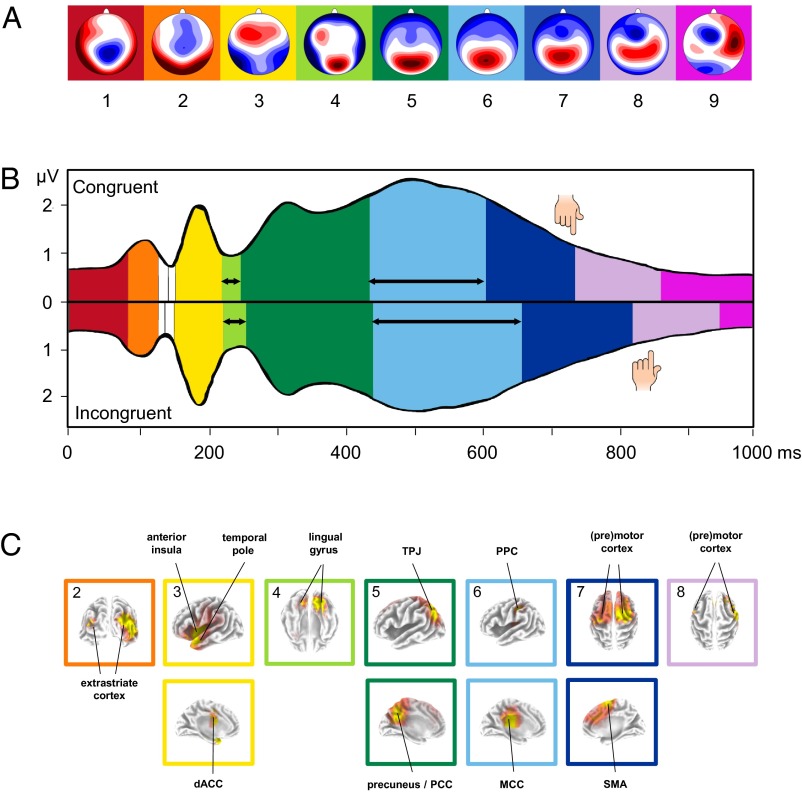
Fig. 1.
Microstate analysis of the IAT-evoked ERPs. (A) Topographies of the nine microstate clusters in the sequence of occurrence. Head seen from above: Red indicates positive values and blue negative values, referred to average reference. The colored background corresponds to the assignment shown in B and C. (B) Microstates across time for the congruent (Upper) and incongruent condition (Lower) plotted over the Global Field Power (GFP). Colors refer to the microstate topographies shown in A. The hand symbols indicate mean response times. The vertical axis indicates GFP (in microvolts); the horizontal axis indicates time (in milliseconds). Black horizontal arrows indicate microstates in which significant, Bonferroni-corrected duration differences were observed between IAT conditions (P < 0.001). Note that we only considered microstates that lasted for at least 10 ms (shorter microstates are shown in white). (C) Localization of the intracortical sources as estimated with sLORETA for the full sequence of microstates during the IAT. Bonferroni-corrected, significant voxels are colored, with increasing t values from red to yellow. Note that, for each microstate, the grading of colors was adapted to accentuate the main activation clusters, such that identical colors in different microstates do not represent identical t values. We labeled the main activation clusters and framed the localization with the same color code as the corresponding microstates in A and B. Please note that intracortical sources are only shown for microstates 2–8 due to the chosen source localization strategy (for details, see SI Materials and Methods and SI Results). PCC, posterior cingulate cortex; SMA, supplementary motor area; TPJ, temporo-parietal junction.

