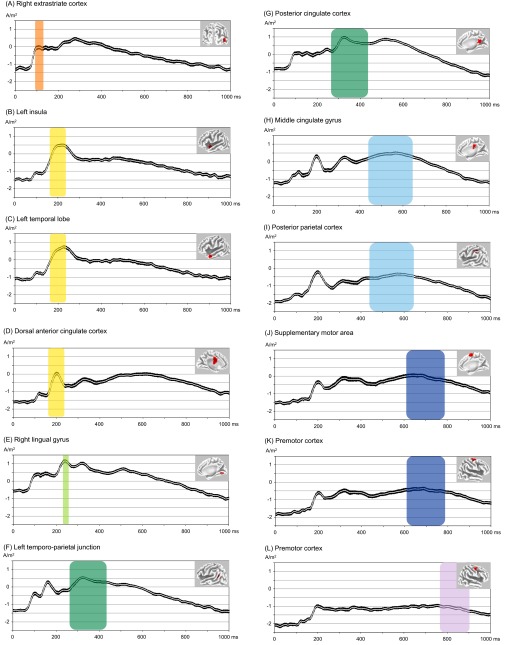
Fig. S4.
Time plots main activation clusters of microstates 2–8. Shown in this figure are subject-wise normalized and log-transformed current source density for regions of interest (ROIs; 10-mm sphere around the maximum t value) comprising the main activation clusters of microstate 2 [(A) Right extrastriate cortex, BA19; x = 50, y = −69, z = 7; MNI], microstate 3 [(B) Left insula, BA13, x = −39, y = 5, z = −5; (C) Left temporal pole, BA38, x = −51, y = 11, z = −21; (D) Dorsal anterior cingulate cortex, BA32, x = −5, y = −5, z = 35], microstate 4 [(E) Right lingual gyrus, BA18; x = 15, y = −67, z = −3], microstate 5 [(F) Left temporo-parietal junction, BA39; x = −36, y = −59, z = 26; (G) Posterior cingulate cortex, BA23; x = 5, y = −52, z = 23], microstate 6 [(H) Middle cingulate cortex, BA23; x = 0, y = −25, z = 33; (I) Posterior parietal cortex, BA40; x = −42, y = −33, z = 44], microstate 7 [(J) Supplementary motor area, BA6; x = 6, y = −2, z = 67; (K) Premotor cortex, BA6; x = 30, y = −5, z = 65], and microstate 8 [(L) Premotor cortex, BA6; x = 46, y = 1, z = 51]. In black, SEs are shown. Further, the time periods of microstate 2–8 (average of the incongruent and congruent condition) are colored with transparent planes. The colored backgrounds correspond to the cluster assignment shown in Fig. 1A.

