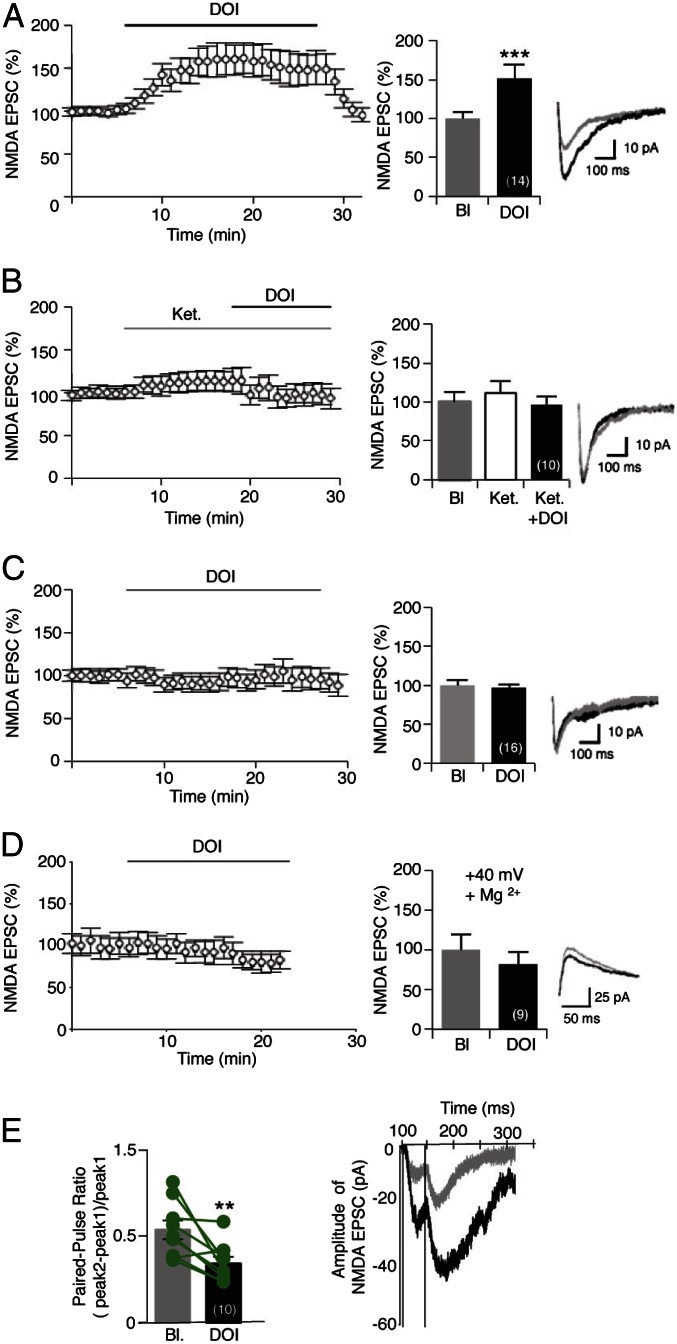
Fig. 1.
5-HT2A receptor activation potentiates NMDA EPSCs in PFC pyramidal neurons. (A–C) Normalized peak amplitude of isolated NMDA currents recorded in acute PFC slices at −60 mV in low magnesium ACSF are illustrated (Left). The histograms represent means ± SEM of NMDA EPSCs (in percent of baseline) measured during the last 2 min of baseline or treatments. In A, slices were perfused with DOI (1 μM) for 20 min (n = 14). ***P < 0.001 vs. baseline (Bl) (Student’s t test). (Right) Representative traces of NMDA EPSCs. In B, Ketanserin (Ket, 1 μM) was perfused in the bath for 12 min before the application of DOI (n = 10, Student’s t test). In C, NMDA currents were measured in acute PFC slices from 5-HT2A−/− mice (n = 16, Student’s t test). (D) Normalized amplitude of NMDA currents recorded at +40 mV in presence of magnesium (n = 9, Student’s t test). The histogram represents means ± SEM of NMDA EPSCs (in percent of baseline) measured during the last 2 min of baseline or treatments. (Right) Representative traces of NMDA EPSCs at +40 mV. (E) Presynaptic origin of 5-HT2A receptor-mediated potentiation of NMDA EPSCs. Paired-pulse facilitation [(peak2 − peak1)/peak1] with 50 ms of interval, measured before (baseline) and after the DOI challenge (1 μM, 10 min, n = 10). **P < 0.01 vs. baseline, Student’s t test. (Right) Representative traces of NMDA EPSCs. See also Figs. S1 and S2.

