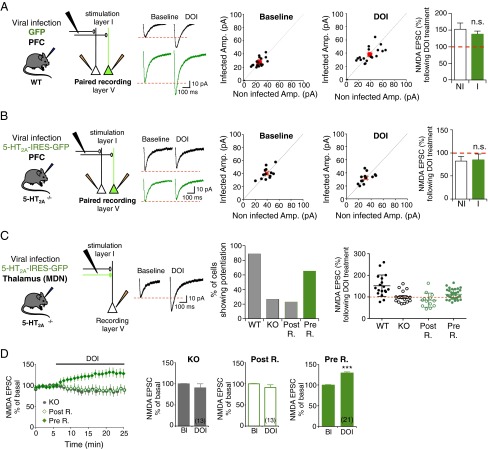
Fig. 2.
Expression of 5-HT2A receptor in MD nuclei rescues DOI-induced potentiation of NMDA EPSCs in 5-HT2A−/− mice. (A and B) The Left panels show a sketch of the experimental protocol. Sindbis viruses expressing GFP constructs (A) or 5-HT2A-IRES-GFP (B) were injected in the PFC of WT (A) or 5-HT2A−/− (B) mice, respectively. Paired recordings were performed 24 h after viral particle injection in nearby infected (green) and noninfected (black) layer V pyramidal neurons. Representative traces of NMDA EPSCs are shown in black (noninfected neuron) and in green (infected neuron). The normalized amplitude of NMDA currents measured before (Baseline) and after DOI application (1 μM, 20 min) in infected (I) neurons was plotted against the normalized amplitude of NMDA EPSCs in noninfected (NI) neurons. The red dot indicates the mean of all values. The histograms show the quantification of NMDA EPSCs after DOI application (normalized to baseline) in simultaneously recorded infected (green) and noninfected (white) layer V neurons. n.s., not significant. (C) A sketch of the experimental protocol is shown in left. Sindbis viruses were injected at P14 in the MD nuclei (MDN) of 5-HT2A−/− mice. Representative traces of NMDA EPSCs are shown. The right histogram represents the percentage of recorded neurons showing a potentiation of NMDA EPSCs after the DOI challenge in 16 of 18, 4 of 16, 3 of 13, and 21 of 32 recorded cells in WT mice, 5-HT2A−/− mice (KO), postsynaptic rescued (Post R.) and presynaptic rescued (Pre R.) 5-HT2A−/− mice, respectively. The distribution of values measured in each condition is illustrated (Right). (D) Time course of normalized peak amplitude of isolated NMDA currents recorded in DOI-treated PFC slices from 5-HT2A−/− mice (KO, gray dots, n = 13), postsynaptic rescued 5-HT2A−/− mice (Post R., empty diamonds, n = 13) and presynaptic rescued 5-HT2A−/− mice (Pre R., full diamonds, only cells showing potentiation were plotted, n = 21). The histograms represent means ± SEM of NMDA EPSCs (in percent of baseline) measured during the last 2 min of baseline or DOI treatment. ***P < 0.001 vs. baseline (Bl), Student’s t test. See also Figs. S3 and S4.

