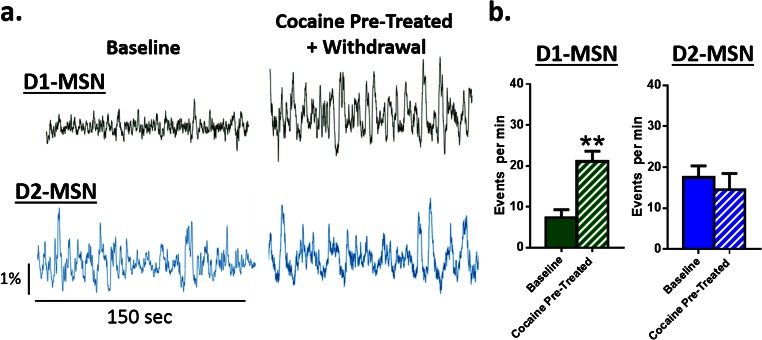
Fig. S3.
Cocaine pretreatment alters baseline D1, but not D2, MSN activity. (A) Representative calcium traces from D1 (Top, green) and D2 (Bottom, blue) MSNs at baseline and following 7 d of cocaine injections and withdrawal. (B) Peak analysis of D1 MSNs (Left) showing that cocaine and withdrawal increases the number of events in the NAc relative to baseline [Student’s t test; t(5) = 4.23, P < 0.01, n = 6]. In contrast, D2 MSN activity (Right) was unchanged [Student’s t test; t(6) = 1.24, P = not significant, n = 7]. **P < 0.01 vs. control. All data are presented as mean ± SEM.

